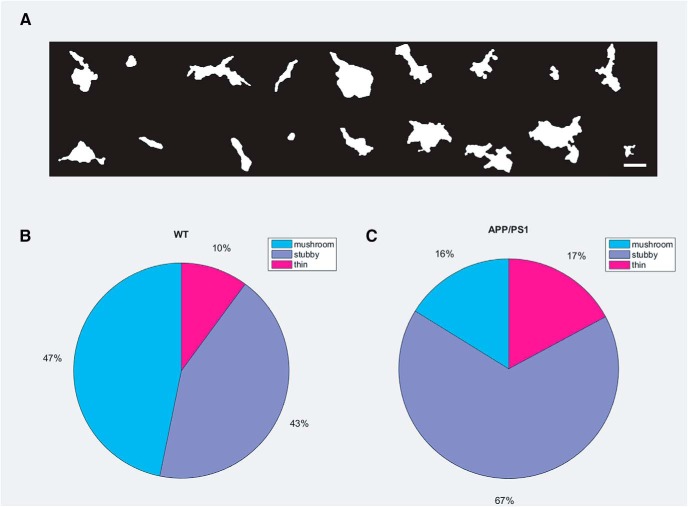
Figure 5.
Comparison of morphologic features of spines obtained by supervised learning algorithm from WT and APP/PS1 primary mice cortical neurons. A, A gallery of different morphologies of F-actin-enriched compartments in primary mice cortical cultures identified as spines. Scale bar = 1 μm; please refer to Extended Data Fig. 5-1 for the validation of supervised learning algorithm for morphological characterization of spines from primary mice cortical neurons. B, A pie-chart representing proportion of mushroom, stubby and thin spines in WT. C, A pie-chart representing proportion of mushroom, stubby and thin spines in the entire population of dendritic spines in APP/PS1; please refer to Extended Data Fig. 5-2 to view a set of morphologies of spines characterized as mushroom and thin spines.

