Figure 6.
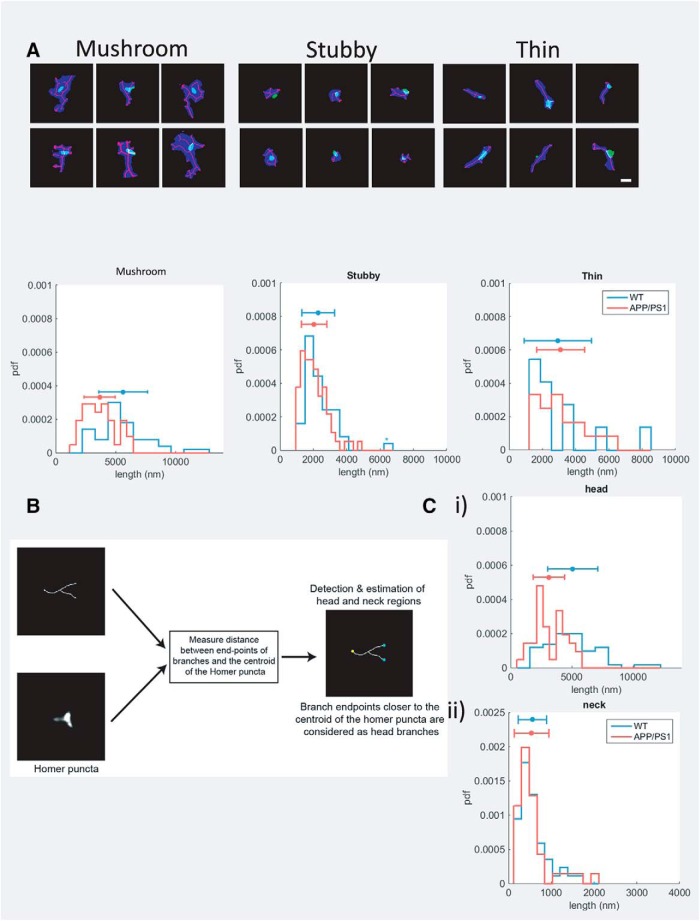
Objective paradigm for segmentation and feature detection in dendritic spines. A, Representative gallery of different classes of dendritic spines are depicted with each class containing six representative spines. Scale bar = 500 nm. We found that the cumulative length of F-actin filaments in mushroom spines were significantly higher in WT spines compared to APP/PS1 spines (average actin filament length: WT mushroom = 5634.5 ± 2034 nm; and APP/PS1 mushroom = 3665.1 ± 1299.2 nm; p < 0.005 for a rank sum test on cumulative F-actin filament lengths for individual spines of WT and APP/PS1 groups), while there was no significant difference in the lengths of the F-actin networks in stubby and thin spines (WT stubby = 2288.5 ± 982.6 nm; APP/PS1 stubby = 2045.4 ± 763.9 nm; WT thin = 2927.3 ± 2023.5 nm; APP/PS1 thin = 3098.9 ± 1439.9 nm; p = 0.12 and p = 0.42 for a rank sum test on cumulative F-actin lengths of stubby and thin spines, respectively). B, The paradigm for feature extraction was performed in two steps. (1) The branch endpoints of the detected ridge of the spine were compared to the centroid of the Homer puncta to define the neck (yellow) and head regions (cyan) of the spine. (2) The length of the ridges was plotted for analysis. B, The difference in the cumulative F-actin filament lengths in mushroom spines was due to difference in their lengths in the head region, rather than the neck (average actin filament length: 5075.7 ± 2048.6 nm and 3126.2 ± 1284.3 nm for WT and APP/PS1 head regions, respectively, p < 0.005 for a rank sum test; 558.7 ± 331.7 and 538.9 ± 404.5 nm for WT and APP/PS1 neck regions, respectively, p = 0.31 for a rank sum test).

