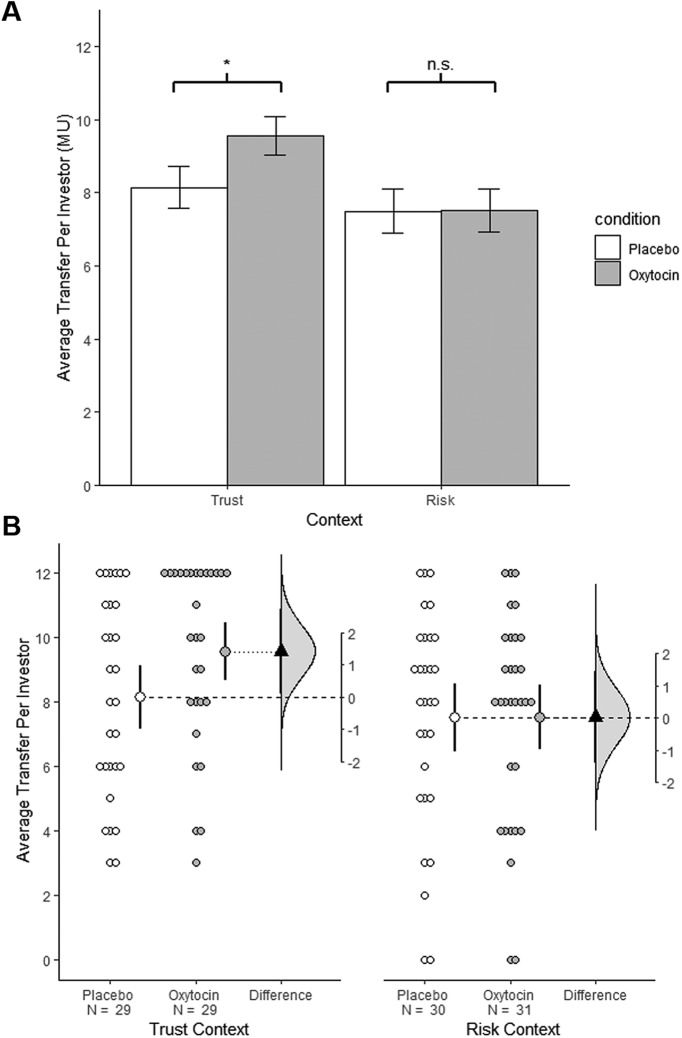
Figure 2.
Visualizations emphasizing testing versus estimation. Both plots are from the same experiments examining the effect of oxytocin on social behavior (Kosfeld et al., 2005). A, A bar graph showing the effect of intranasal oxytocin on the amount invested in a trust (left) and risk (right) game. Each bar represents group means and error bars represent ± 1 SE. There is a statistically significant effect of oxytocin in the trust game (p = 0.04, on tailed), but not in the risk game. The difference in statistical significance status can give the impression that oxytocin specifically influences performance in the trust game, but a formal test for an interaction is not significant (p = 0.23). B, Estimation plots of the same data. The plots compare investment in the oxytocin and investment condition in the trust (left) and risk (right) games. Small circles represent individual participants. Large circles with error bars show group means with 90% confidence intervals (90% confidence was selected to match the stringency of the one-tailed test used in the original paper). The triangles represent the observed difference between groups, with 90% confidence intervals. The curves indicate the entire range of expected sampling error in estimating the mean difference. Note the considerable overlap in the estimated oxytocin effects in the trust and risk games. This correctly suggests that there are many compatible effect sizes in common and that these data do not support strong claims for an interaction. This figure was adapted with permission from Calin-Jageman and Cumming (2019).

