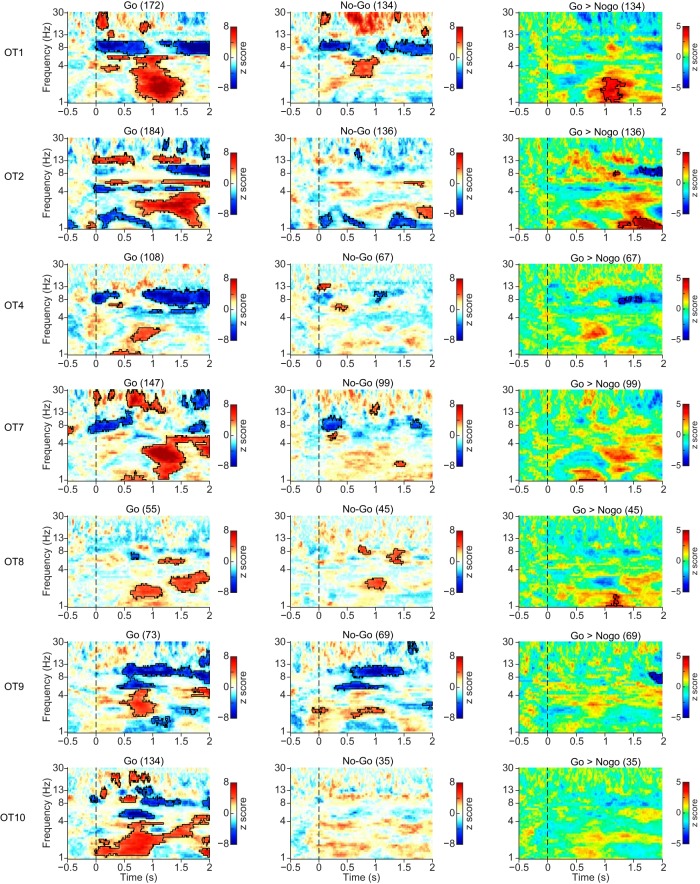
Figure 8.
PLI analysis for seven individual rats for Go and No-Go trials, and the difference between trials. The PLI was baseline corrected ([−0.5, 0] s before tone onset). The significance of the increase was tested using a cluster-based permutation test. The threshold for initial clustering was p = 0.001. Outline regions indicate statistically significant clusters (p < 0.05). PLI increase difference between Go and No-Go trials. Most animals showed a significant increase in PLI beginning during the sampling period (sampling occurred 0–0.7 s) which extended into the reward period (1–2 s after trial onset). As shown in the right column, there was no consistent difference between Go and No-Go trials.

