Figure 2.

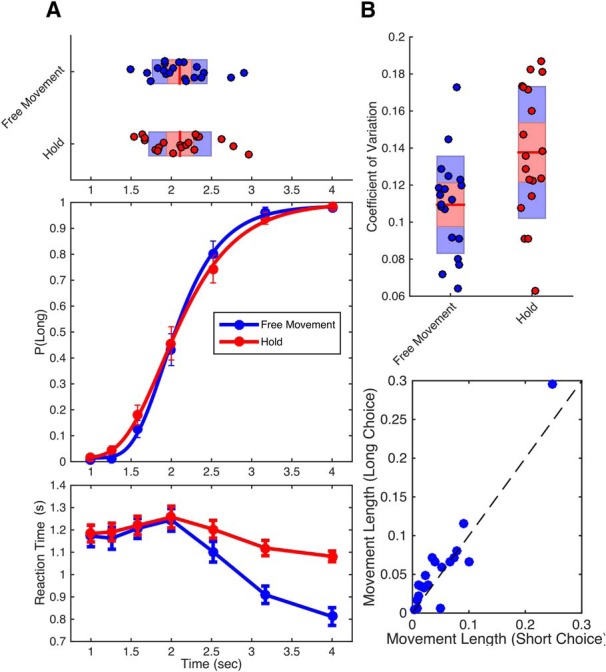
Behavioral data from free-movement and hold experiments. A, Middle, The average proportion of trials on which subjects classified durations as long as a function of tested duration. Psychometric curves represent fits to the average data. Red symbols represent data from Experiment 2 (hold); blue symbols represent data from Experiment 1 (free-movement). Bottom, Average chronometric data, with reaction time as a function of duration. Reaction time was notably similar for both groups for durations under 2 s, but then became increasingly faster for free-movement subjects. Top, Individual bisection points, derived from fitted curves. Boxplots display the mean (red line), bounded by the 95% confidence interval (red shaded region) and the SD (blue region). B, Top, CV data for both groups, demonstrating significantly lower variability for the free-movement experiment than the hold experiment. Bottom, The average movement length for subjects in the free-movement experiment for 2 s trials classified as long or short; subjects chose long more often when they moved more during the 2 s tone interval. Dashed line represents the identity. Results remained significant with removal of the outlier. Error bars represent SE.
