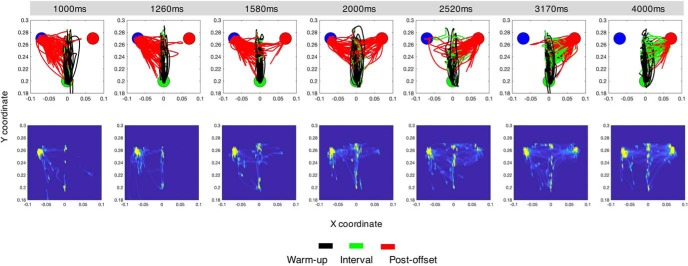
Figure 3.
Movement trajectories for an example subject in Experiment 1 (free-movement). Top row, Layout of the start position (green filled circle), and short (blue filled circle) and long targets (red filled circle) is the same as in Figure 1C. Distance is in meters. Each panel represents the total number of movements for one of seven intervals used in our temporal bisection task. Color-coding of traces reflects hand movement through the progression of the given trial (black, warm-up period; green, during the tone duration; red, after the tone until the decision). As can be observed, for relatively short durations (<2000 ms), the majority of movements smoothly progress from the starting position at the bottom of the panel to the short target location (left target). As durations increase (1580, 2000, and 2520 ms), choices split between the short and long locations (note the directions of the red traces). Notably, for relatively long durations (>2000 ms), subject arm movements initially move toward the short location, but then shift toward the long location (right target) once the interval has elapsed past a certain point. Bottom row, Density estimates for arm location only during the interval portion of each trial (brighter pixels represent a greater proportion of the trial occupied in that location), displaying the shift to the long duration target with longer intervals.

