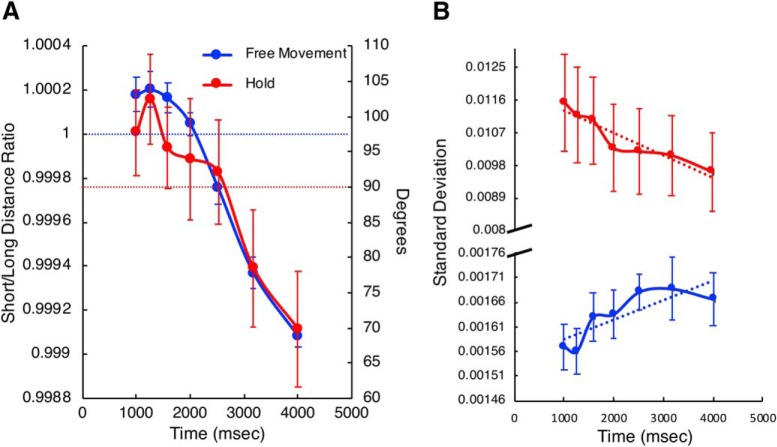
Figure 6.
The decision process is represented within the movement trajectories and force patterns. A, Position and force data for both experiments as a function of tone duration. Red symbols represent data from Experiment 2 (hold); blue symbols represent data from Experiment 1 (free-movement). The left axis displays the ratio of the Euclidean distance from arm position to the long and short targets for the free-movement group; values >1 (horizontal blue dashed line) indicate the subject was closer to the short location, and vice versa. The right axis displays the force direction, in degrees, that subjects were exerting on the arm at tone offset. Values above 90° (horizontal red dashed line) indicate the subject was pushing toward the short target (105°), whereas below 90° indicate pushing toward the long target (75°). B, Intertrial variability (SD) of the arm position was measured for the final 100 ms of arm movements across trials for each duration. Free-movement subjects (blue trace) demonstrated linearly increasing SD with tone duration, whereas hold subjects (red trace) displayed linearly decreasing SD. Note the axis break and scale difference in the y-axis, demonstrating that hold subjects exhibited greater variability overall compared with free-movement subjects. Error bars represent SE.

