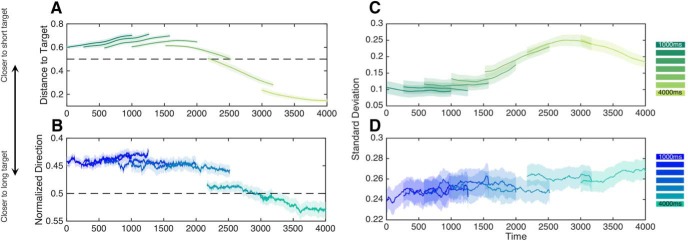
Figure 7.
Differences in movement dynamics across tasks. Movement dynamics for the free-movement group (A) and hold group (B) during the presentation of each interval. Data are shown for the last 1000 ms of each presented interval. Dashed lines represent the 50% inflection point between the long and short duration targets, with values above this line representing a closer relative location (top) or a closer force direction (bottom) to the short target location. All displayed data are sigmoid transformed to reduce the influence of extreme values on logistic regression (see Materials and Methods). For both sets, movement dynamics display a transition from proximity to the short duration target to the long duration target as the interval elapses; additionally, differences in position or force could be distinguished well before the interval offset. C, Intertrial variability of movement dynamics displayed in free-movement and the hold group (D). Both panels display the average within-subject SD of movement data from their corresponding left panels. For both groups, intertrial variability increases as the presented interval elapses, but with different profiles. Further, variability is dramatically lower for the free-movement group compared with the hold group (note the difference in the vertical scale). Shaded regions display SE.

