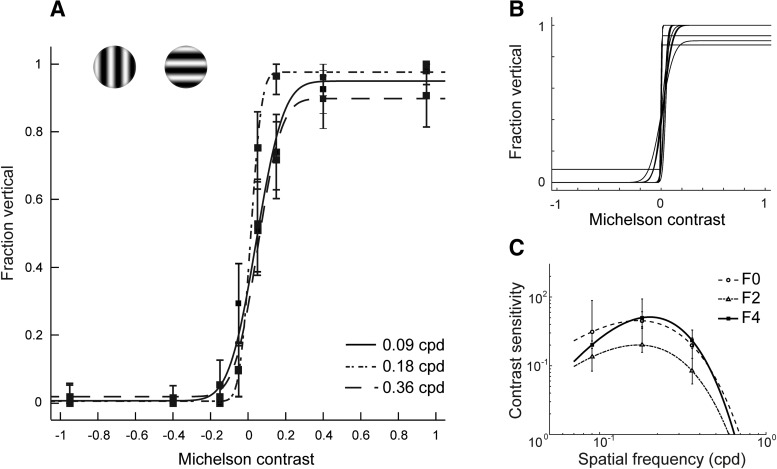
Figure 2.
Behavioral estimates of visual acuity. A, Psychometric curves for one ferret (F4) for three spatial frequencies. Error bars represent 95% confidence intervals (see Materials and Methods). B, Psychometric curves fit to data from individual testing sessions using a spatial frequency of 0.18 cpd (ferret F4); 13 sessions are shown here. C, Contrast sensitivity curves for each ferret. Error bars represent 68% confidence intervals (see Materials and Methods).

