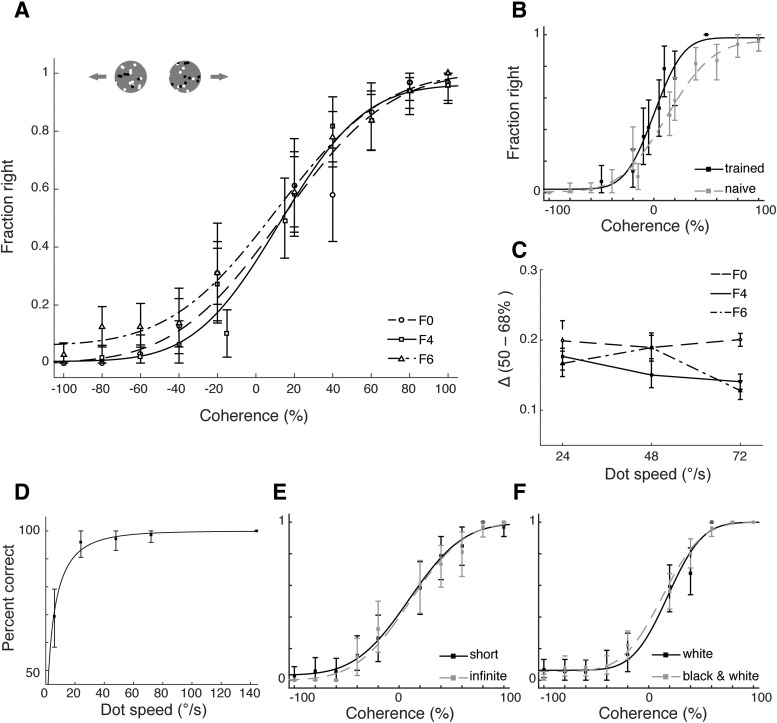
Figure 3.
Motion integration thresholds. A, Psychometric curves for each ferret on the motion integration task (dot speed 48°/s). B, Impact of training on motion integration thresholds: performance for F4 at the time of initial threshold measurements, and after 11 additional sessions. C, Sided coherence threshold Δ as a function of dot speed for each ferret. D, Performance of ferret F4 for RDK of 60% coherence as a function of dot speed. E, Performance comparison for short versus infinite dot lifetime (data for ferret F0). F, Performance comparison for white dots on a black background versus black and white dots on a gray background (data for ferret F6). All error bars, with exception of C, represent 95% confidence intervals. Error bars for C are 68% confidence intervals.

