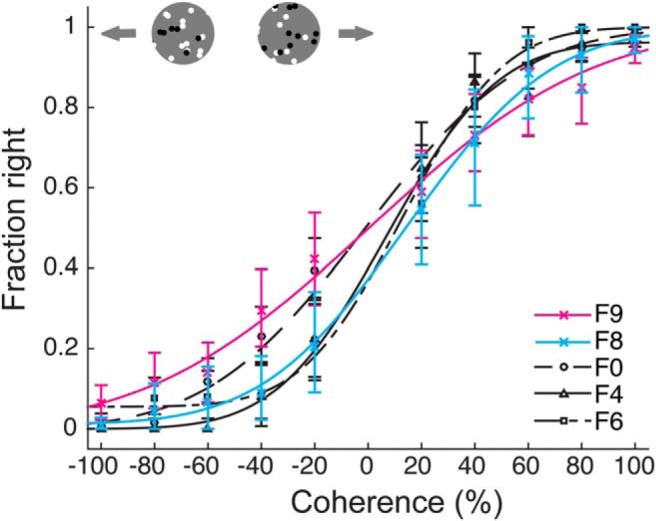
Figure 5.

Comparison of motion integration thresholds measured using head-fixed and freely-moving paradigms. Psychometric curves from all ferrets for the motion integration task at 72°/s. Colored lines show the performance of the head-fixed animals, F8 and F9. Black lines show the performance of freely moving animals (F0, F4, and F6). Error bars represent 95% confidence intervals.
