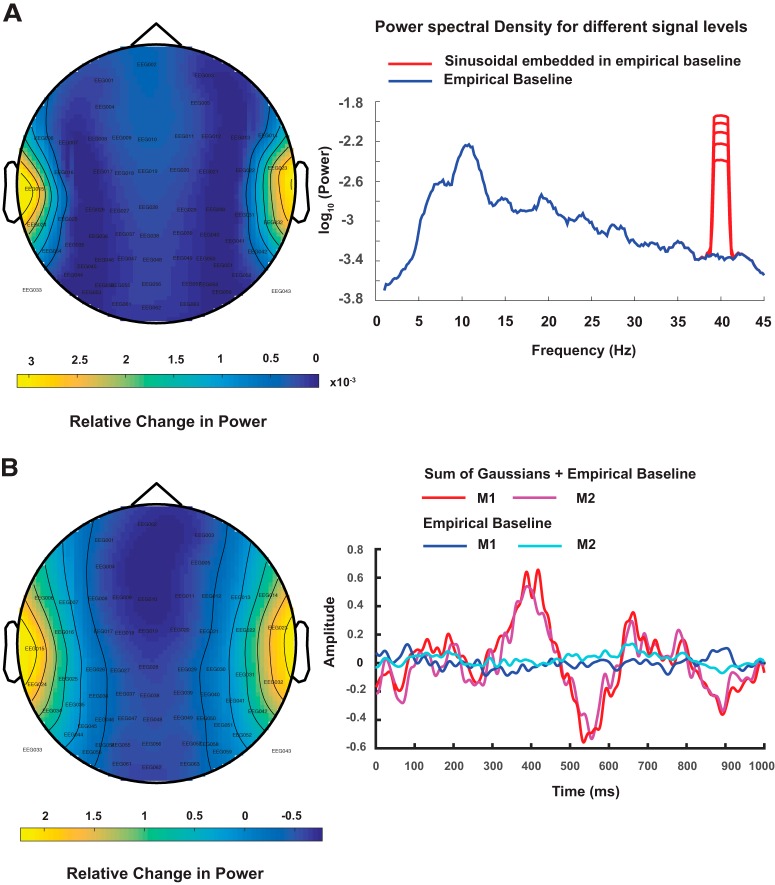
Figure 1.
A, Topoplot of the difference in peak of spectral power at 40 Hz obtained from simulated EEG data where dipolar source time series was represented by a sinusoidal signal with frequency 40 Hz embedded in empirical resting state EEG and empirical resting state EEG as baseline. Spatially averaged power spectra obtained from averaging the channel-by-channel spectrum from hypothetical scalp sensors are plotted in logarithmic scale. The time series on the scalp were obtained by applying forward modeling techniques on dipolar sources at auditory cortex locations using the Boundary element method (BEM). B, Topoplot of the peak of difference signal when a mixture of Gaussian pulses was used to simulate ERP and empirical resting state EEG as baseline in BEM model as described in A. The time series for dipole dynamics are plotted at hypothetical M1 and M2 sensors located near to the auditory cortices. The positive peak at 400 ms was used for generating the topoplot.

