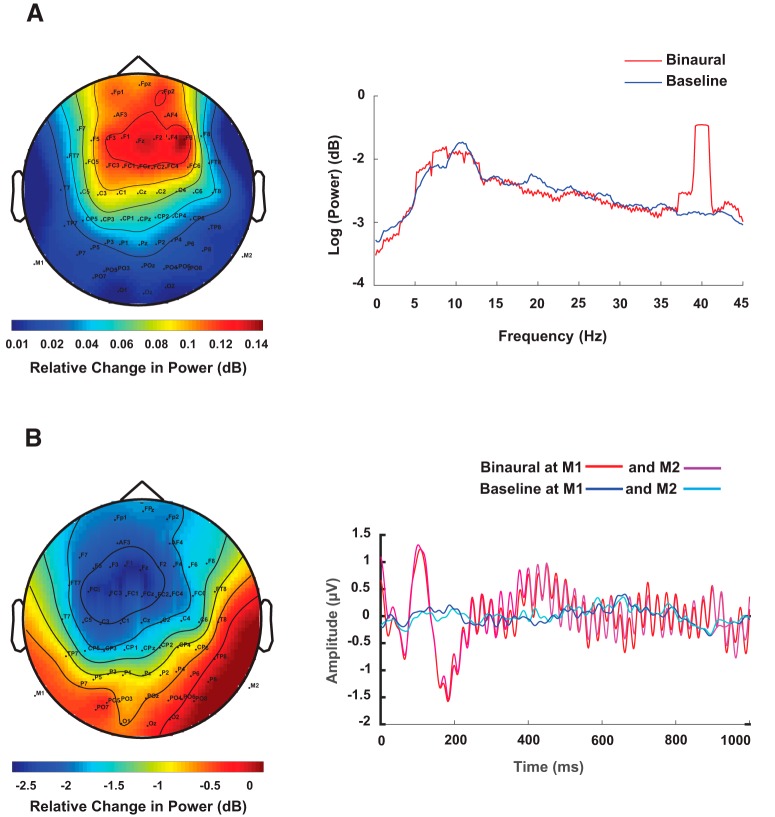
Figure 6.
A, Topoplot of spectral power difference at 40 Hz and grand average of spectral power across all sensors, trials, and participants in binaural and the baseline conditions. Power spectral density was calculated for 5-s windows after rejecting an initial 50 s out of total duration of 200 s for which the rhythmic tones were played. B, ERP responses of channels M1 and M2 across trials and participants for binaural and silent baseline conditions and the topoplot for the difference signal at the peak of N100 response (at 110 ms).

