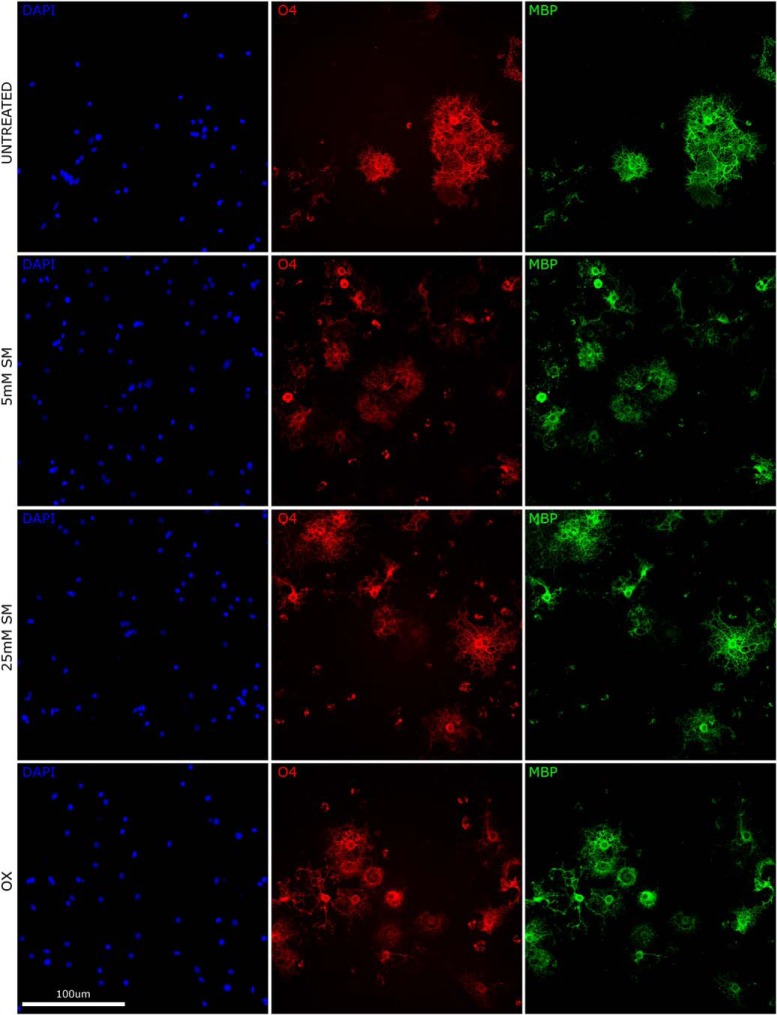
Figure 4.
Representative illustration of OPC proliferation, oligodendrocyte maturation, and differentiation in the pure OPC culture per treatment groups at 10 DIV. Co-immunostaining with DAPI (blue), anti-O4 (red), and anti-MBP (green) of coculture at 21 DIV for the untreated (UT), 0.5 μM SM (SM 0.5), 5 μM SM (SM 5), 25 μM SM (SM 25), and 0.3 μM olesoxime (OX; positive control) groups. Proliferation was measured by number of cells stained with DAPI, maturation by number of O4+ cells, and differentiation by number of MBP+ cells.

