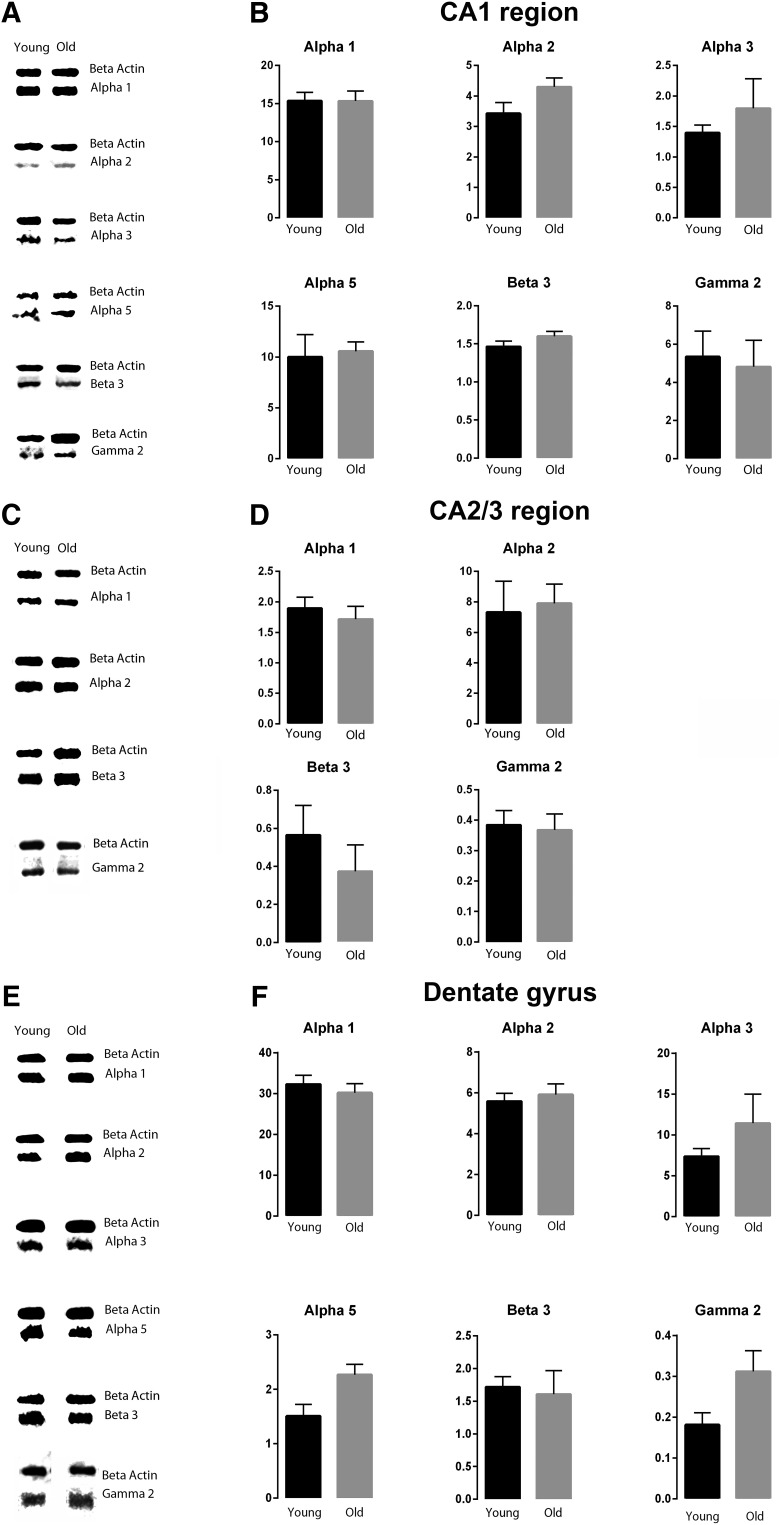
Figure 2.
Representative immunoreactive Western blot bands from young male (Young) and old male (Old) hippocampal CA1, CA2/3, and DG homogenates following incubation with antibodies to the GABAAR α1, α 2, α 3, α 5, β3, and γ2 subunits (A, CA1; C, CA2/3; E, DG) and corresponding signal intensity graphs (B, CA1; D, CA2/3; F, DG). Signal intensity for each GABAAR subunit Western blot band was measured and normalized to their corresponding β-actin signal for each age group. The data are graphed as mean ± SEM (n = 6, with 3 replicates; unpaired Mann–Whitney test).

