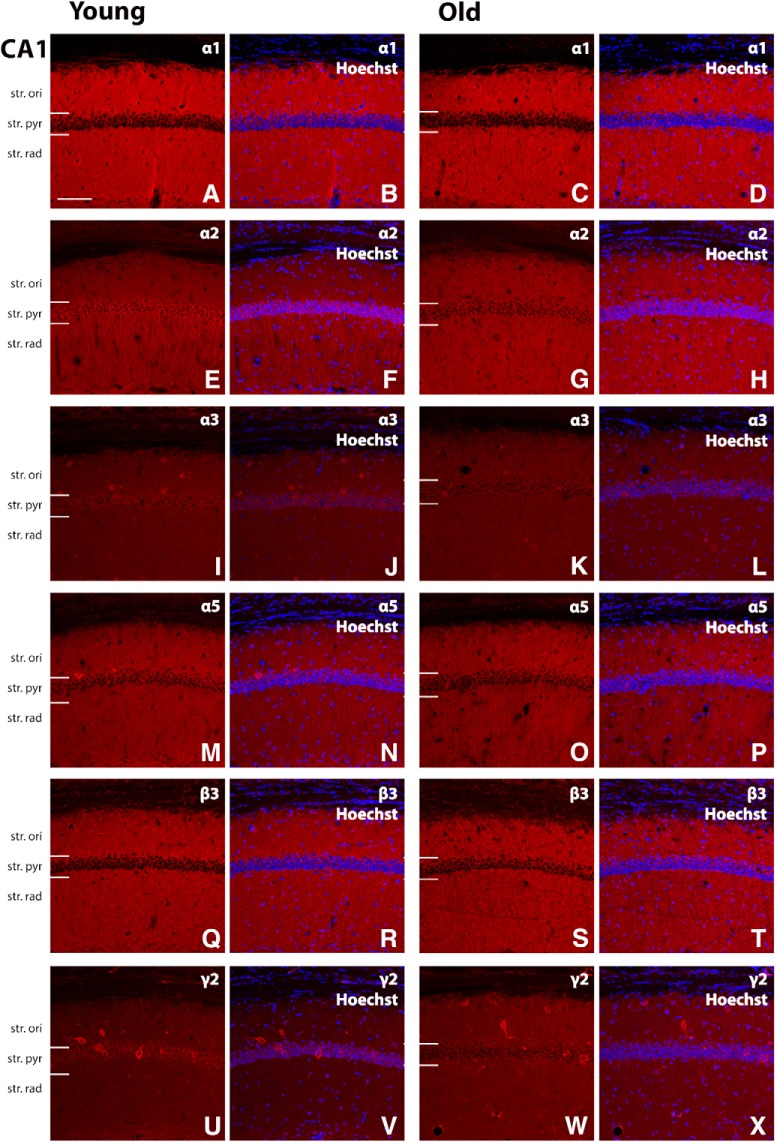
Figure 3.
Representative photomicrographs of the CA1 region showing GABAAR α1, α2, α3, α5, β3, and γ2 subunit expression (red) and α1, α2, α3, α5, β3, and γ2 immunoreactivity overlaid with Hoechst (blue) labeling for representative young and old mice (A–X). The strong α2 subunit immunoreactivity is evident around the soma, proximal dendrites, and possibly in the axon-initial segment of individual pyramidal cells of the CA1 region in young animals but the labeling is decreased at these sites in aged mice (E–H). Scale bar, 50 μm. Startum (str), oriens (ori), pyramidale (pyr), radiatum (rad).

