

Abstract
Background:
More and more automated efficient ultrasound image analysis techniques, such as ultrasound-based computer-aided diagnosis system (CAD), were developed to obtain accurate, reproducible, and more objective diagnosis results for thyroid nodules. So far, whether the diagnostic performance of existing CAD systems can reach the diagnostic level of experienced radiologists is still controversial. The aim of the meta-analysis was to evaluate the accuracy of CAD for thyroid nodules’ diagnosis by reviewing current literatures and summarizing the research status.
Methods:
A detailed literature search on PubMed, Embase, and Cochrane Libraries for articles published until December 2018 was carried out. The diagnostic performances of CAD systems vs radiologist were evaluated by meta-analysis. We determined the sensitivity and the specificity across studies, calculated positive and negative likelihood ratios and constructed summary receiver-operating characteristic (SROC) curves. Meta-analysis of studies was performed using a mixed-effect, hierarchical logistic regression model.
Results:
Five studies with 536 patients and 723 thyroid nodules were included in this meta-analysis. The pooled sensitivity, specificity, positive likelihood ratio, negative likelihood ratio, and diagnostic odds ratio (DOR) for CAD system were 0.87 (95% confidence interval [CI], 0.73–0.94), 0.79 (95% CI 0.63–0.89), 4.1 (95% CI 2.5–6.9), 0.17 (95% CI 0.09–0.32), and 25 (95% CI 15–42), respectively. The SROC curve indicated that the area under the curve was 0.90 (95% CI 0.87–0.92). The pooled sensitivity, specificity, positive likelihood ratio, negative likelihood ratio, and DOR for experienced radiologists were 0.82 (95% CI 0.69–0.91), 0.83 (95% CI 0.76–0.89), 4.9 (95% CI 3.4–7.0), 0.22 (95% CI 0.12–0.38), and 23 (95% CI 11–46), respectively. The SROC curve indicated that the area under the curve was 0.96 (95% CI 0.94–0.97).
Conclusion:
The sensitivity of the CAD system in the diagnosis of thyroid nodules was similar to that of experienced radiologists. However, the CAD system had lower specificity and DOR than experienced radiologists. The CAD system may play the potential role as a decision-making assistant alongside radiologists in the thyroid nodules’ diagnosis. Future technical improvements would be helpful to increase the accuracy as well as diagnostic efficiency.
Keywords: computer-aided diagnosis system, meta-analysis, sensitivity and specificity, thyroid nodules, ultrasound
1. Introduction
Thyroid nodules, as the most common endocrine system disease, are detected in up to 19% to 68% of the general population with 3% to 10% of malignancy.[1,2] In 2018, 567,233 (3.1%) people worldwide were diagnosed as thyroid cancer.[3] The incidence of thyroid cancer has increased 2.4 times over the last 30 years.[3,4] Accurately identifying the preoperative distinction between benign vs malignancy has been an ongoing challenge. Ultrasound, as the most accurate imaging modality, is widely used in preoperative evaluation and decision-making for fine-needle aspiration (FNA).[5–7] It is critical to be able to differentiate benign from malignant process.[8,9] However, the diagnostic accuracy of ultrasound depends on radiologists’ experience, echo perturbation and speckle noise.[8,10,11] The sensitivity and the specificity of thyroid carcinoma detection by ultrasound were 40.3% to 93% and 54% to 100%, respectively.[10,12,13] Less experienced radiologists had a higher misdiagnosis rate and increased the rate of unnecessary FNA.
Computer-aided diagnosis (CAD) system with novel artificial intelligence (AI) techniques is widely developed for automated efficient ultrasound image analysis recently.[14,15] Some studies reported that CAD system had been used to assess breast and lung cancers to provide a suggestion for diagnosis with radiologists.[16–20] CAD system employs a deep neural network in general, which is a novel computer model automatically judging benignity and malignancy of thyroid nodules in new images after learning lots of images with existing labels.[21,22] Being a real-time and noninvasive diagnosis suggestion, CAD becomes a widely employed imaging method for the preoperative evaluation and follow-up of thyroid nodules. However, the practicality and effectiveness of CAD for thyroid nodules were still controversial. The point of contention is time consumption and accuracy of CAD in comparison with the experienced radiologists. The CAD lacks clinical practicality if costing longer time to make the diagnosis of thyroid nodules than radiologists do and failing to achieve a real-time performance. Additionally, regional identification of thyroid nodules[23] and the judgment of thyroid nodules between benignity and malignancy[24,25] are the 2 dimensions of evaluating effectiveness.
To our knowledge, there is no review or meta-analysis of the effectiveness of CAD for thyroid nodules. Therefore, the aim of our study was to conduct the analysis to evaluate the accuracy of CAD for thyroid nodules by reviewing current literatures and summarizing the research status.
2. Materials and methods
2.1. Search strategy and selection criteria
This study is a meta-analysis of previously published studies, thus no ethical approval or patient consent was necessary. Two authors independently searched literatures published in English language until December 2018 by using PubMed (including MEDLINE), Embase, and Cochrane Libraries. The search strategy is listed below: 1# thyroid [Mesh term] 2# ultrasound or ultrasonography or ultrasonic [Title/Abstract] 3# artificial intelligence (AI) or computer-aid diagnosis or neural network or deep learning [All Fields] 4# 1 and 2 and 3. After screening based on title and abstract of studies, the remaining articles were assessed based on full manuscript and excluded with reasons when appropriate. The reference lists of the included articles were examined for any further studies that could be included. We cross-checked the article list in the identified publications and independently extracted the data from each study with full text.
The inclusion criteria for relevant studies were as follows: AI technology or CAD system had been used to diagnose thyroid nodules on ultrasound, clinical studies with sufficient data to reassess sensitivity and specificity of CAD system for diagnosis of thyroid nodules, absolute numbers of true positive (TP), true negative (TN), false positive (FP), and false negative (FN) data had been presented, studies with more than 10 patients, and no data overlap. Studies were excluded as follows: studies on AI algorithms of CAD system, case reports, conference proceeding, editorial comments and letters to the editor, which do not contain the original data, full text not to be accessed online or requested from authors, and studies not in English.
2.2. Quality assessment and data extraction
The overall quality of the included studies in this review was critically appraised by 2 authors independently, based on 15-item modified Quality Assessment of Diagnostics Accuracy Studies-2 (QUADAS-2).[26] The QUADAS-2 tool primarily assesses 4 domains: risk of bias in patient selection, index test, reference standard, and the timing of reference test. Discrepancies between the researchers were resolved by discussion. To decrease the bias in the selection of studies and in the data extraction, reviewers who were blinded to the journal, author, institution, and date of publication independently selected articles based on the inclusion criteria. Scores were assigned to study design characteristics and examination results by using a standardized form that was based on the QUADAS-2 tool.
A standardized data form was used to extract all data we would evaluate. The information which we collected from each study includes the study basic (author, year of publication and country of origin), study design (prospective or retrospective), patients’ characteristics and technical aspects. Each study was analyzed to retrieve the numbers of TP, TN, FP, and FN findings of CAD system and radiologists, according to the reference standard. Only studies providing such complete information were finally included in the meta-analysis.
2.3. Statistical analysis
All data from each eligible study were extracted in Excel 2007 (Microsoft Corporation, Redmond, CA) and the statistical analyses in this review were conducted by STATA software, version 14.0 (StataCorp LP, College Station, TX). Summary sensitivity, specificity, positive likelihood ratios, negative likelihood ratios, and diagnostic odds ratio (DOR) with 95% confidence interval (CI) were performed. We used the bivariate random-effects model for analysis and pooling of the diagnostic performance measures across studies.[27] Each data point of the summary receiver operator characteristic (SROC) graph comes from an individual study.[28] The SROC curve is formed based on these points to reveal pooled accuracy.[28] Between-study statistical heterogeneity was assessed using I2 and the Cochrane Q test on the basis of the random-effects analysis. When statistical heterogeneity was substantial, we performed meta-regression to identify potential sources of bias.[29] Publication bias was examined using the effective sample size funnel plot and associated regression test of asymmetry described by Deeks et al.[30] Two-sided P ≤ .05 was considered statistically significant.
3. Results
3.1. Literature search and selection of studies
After the comprehensive computerized search was performed and references lists were extensively cross-checked, our research yielded 1206 records on or before December 15, 2018, including 425 articles from PubMed,762 articles from Embase, and 19 articles from references. Excluding the duplicates, unrelated topics, unoriginal studies, and non-English articles, 16 full-text articles[14,24,31–40] were assessed for eligibility. Finally, 5 studies[31–35] were selected because of the eligibility for the systematic review and meta-analysis. There were 11 articles[14,15,24,36–43] excluded due to various reasons. We excluded 7 full-text articles[14,24,36–40] because they mainly studied on the design of algorithms of CAD system rather than on clinical practice. In addition, the study conducted by Choi et al[41] only focused on computerized analysis of calcification of thyroid nodules as visualized by ultrasonography rather than the whole process of diagnosis, the study conducted by Acharya et al[15] was about Hashimoto Thyroiditis rather than thyroid nodules, the study conducted by Lin et al[42] focused on CAD-assisted ultrasound diagnosis of [18F] FDG-positive thyroid nodules not simply on CAD systems, and the study conducted by Zhu et al[43] aimed to build an artificial neural network to discriminate malignant from benign thyroid nodules rather than evaluate an existing diagnostic system, thus we excluded these 4 full-text articles, as well. There were no additional studies found by screening the references of these articles. The detailed procedure of study selection in the current meta-analysis is shown in Figure 1.
Figure 1.
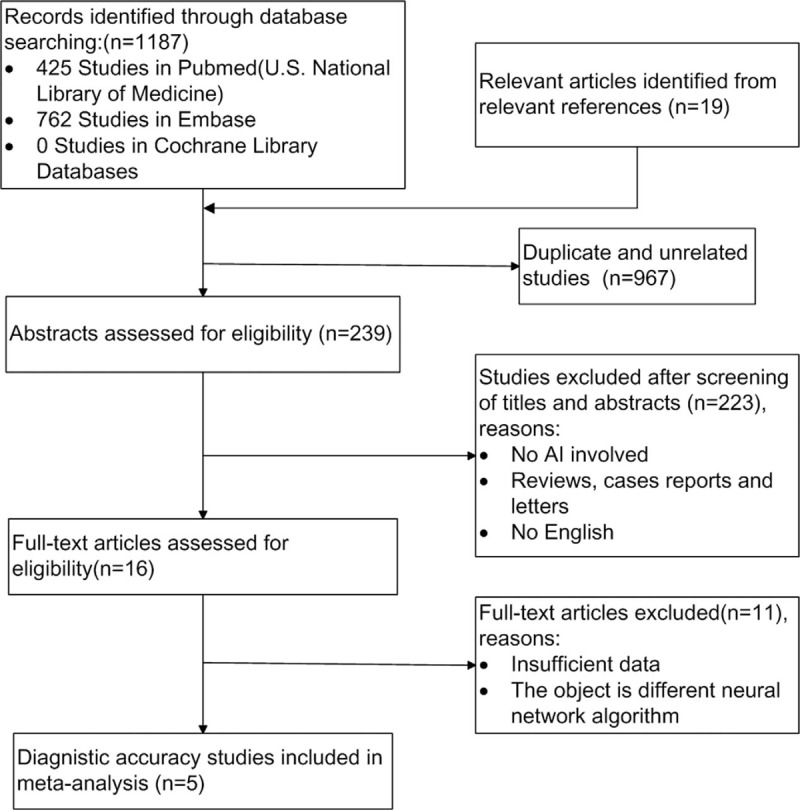
Flow chart of the search for eligible studies on diagnostic performance of computer-aided diagnosis system.
3.2. Study description and characteristics
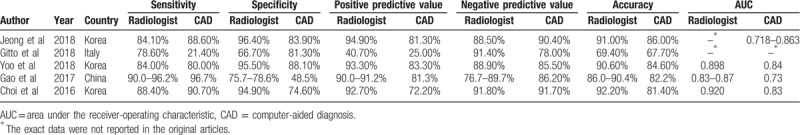
The basic characteristics of included studies were presented in Table 1. We conducted all analyses based on per-patient data. Among 5 included studies, there were 3 prospective studies[31,34,35] and 2 retrospective studies.[32,33] All studies were published during recent 3 years, 3 studies in Korea,[31,34,35] 1 study[32] in China, and 1 study[33] in Italy. The CAD in 4 studies[31,33–35] was developed by Samsung and the remaining CAD in the Chinese study[32] was independently developed by laboratory. There was a total of 536 patients and 723 thyroid nodules in the included studies. Among thyroid nodules, 299 nodules were benign and 424 nodules were malignant. The average sizes of benign or malignant thyroid nodules were 1.1 to 1.8 or 0.9 to 1.8 cm. The nodules in included studies were identified by pathologic diagnosis, such as FNA or surgery. Jeong et al[35] compared the diagnostic performance of CAD system based on the operators’ experience (0–5 years) with an experienced radiologist. Gitto et al[33] compared the diagnostic performance of CAD system with radiologist in the characterization of low-to-high suspicion thyroid nodules based on the Thyroid Imaging Reporting and Data System (TIRADS). Yoo et al[34] compared the diagnostic performance of the radiologist, the CAD system and the CAD-assisted radiologist. Gao et al[32] compared the diagnostic efficiency of CAD system with an experience radiologist based on different standards, such as the TIRADS (K-TIRADS and ACR TIRADS) and the American Thyroid Association (ATA). Choi et al[31] made the subgroup analysis to compare the diagnostic performance of the CAD system and radiologist for thyroid malignancies >1 cm. The diagnostic performance results (sensitivity, specificity, positive predictive value, negative predictive value, accuracy and area under the receiver-operating characteristic [AUC]) of CAD system or experienced radiologists for thyroid nodules in the 5 included studies are presented in Table 2.
Table 1.
Characteristics of the included studies.
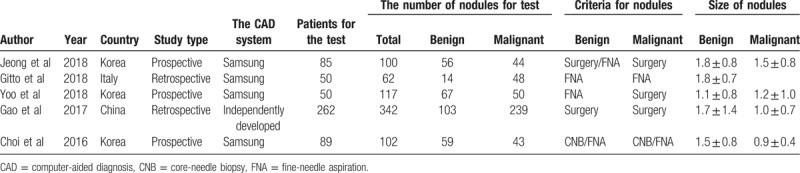
Table 2.
Comparison of diagnostic performance of computer-aided diagnosis system and experienced radiologist.
3.3. Study quality assessment and publication bias
Results of QUADAS-2 assessment are presented in Figures 2 and 3. The quality of studies varied from moderate to high. The main causes of potential bias were attributed to patient selection, index test, and flow and timing. The quality of the included studies was deemed satisfactory. The Deeks funnel plot asymmetry test showed P = .39 and indicated no publication bias, as shown in Figure 4.
Figure 2.
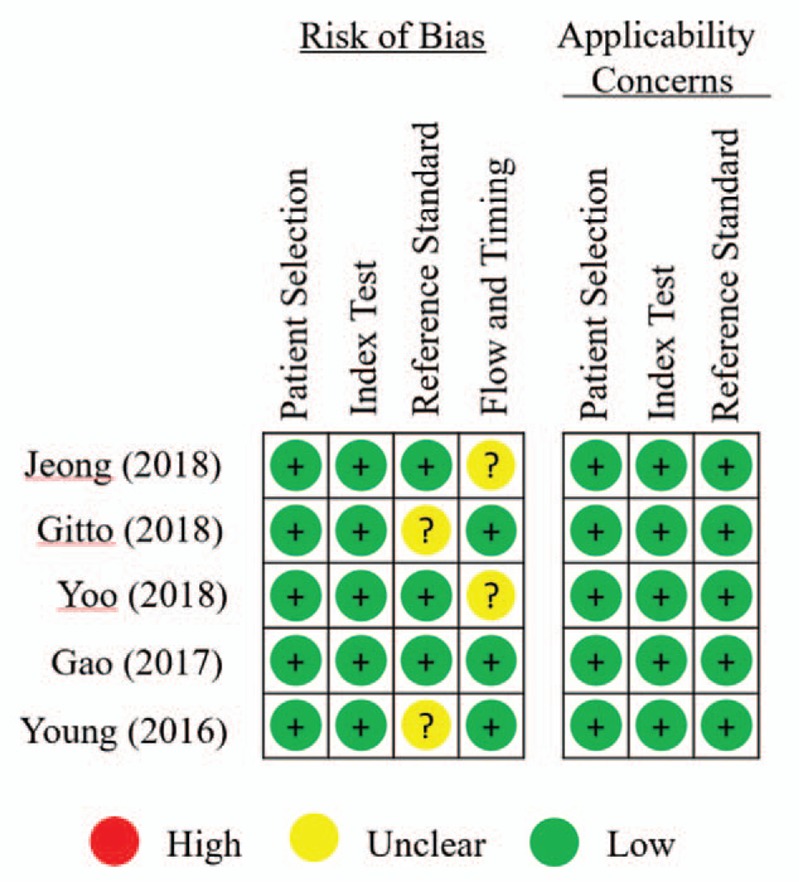
The results of methodologic quality analysis for each study in meta-analysis according to Quality Assessment of Diagnostic Accuracy Studies 2 (QUADAS-2).
Figure 4.
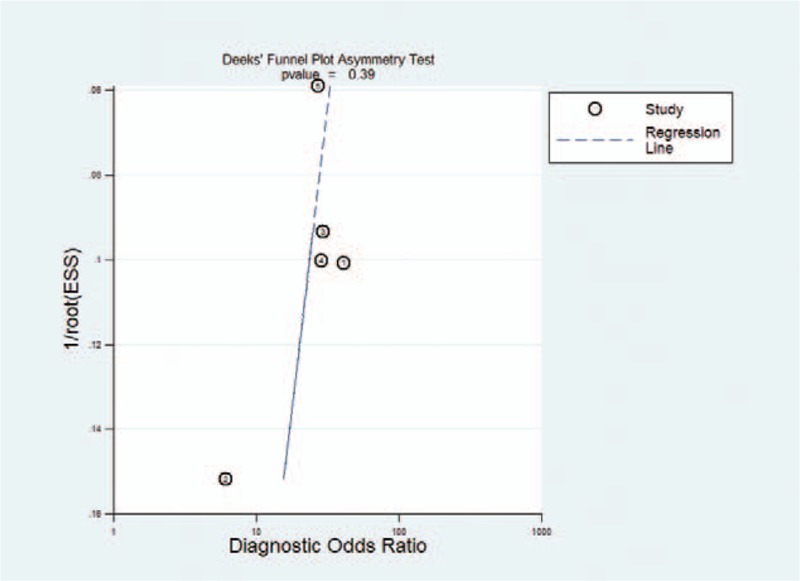
Results of Deeks’ funnel plot of asymmetry test for publication bias. Nonsignificant slope indicates that no significant bias was found.
Figure 3.
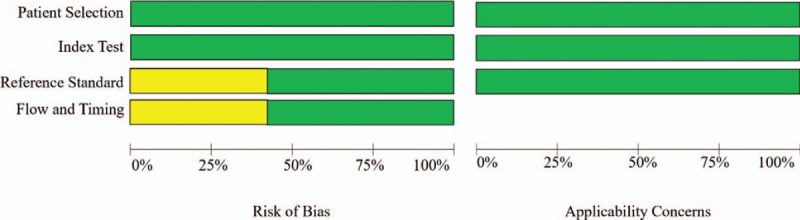
Summary of results of methodologic quality analysis of 5 studies in meta-analysis according to Quality Assessment of Diagnostic Accuracy Studies 2 (QUADAS-2).
3.4. Diagnostic accuracy and heterogeneity evaluation
The diagnostic performance results of CAD system or experienced radiologists for thyroid nodules in the 5 included studies in the meta-analysis are presented in Table 3. The pooled sensitivity, specificity, positive likelihood ratio, negative likelihood ratio, and DOR for CAD system were 0.87 (95% CI 0.73–0.94), 0.79 (95% CI 0.63–0.89), 4.1 (95% CI 2.5–6.9), 0.17 (95% CI 0.09–0.32), and 25 (95% CI 15–42), respectively. The Forest figures of sensitivity, specificity, and DOR of CAD system were showed in Figures 5 and 6. The heterogeneity of sensitivity, specificity and DOR of CAD system in the meta-analysis were showed as I2 = 93.53% (95% CI 89.44–97.63%), I2 = 89.67 (95% CI 82.20–97.14%), and I2 = 15.5% (P = .315), respectively. Figure 7 shows the SROC curve and indicated that the area under the curve was 0.90 (95% CI 0.87–0.92).
Table 3.
The meta-analysis results of diagnostic performance of CAD, CAD by Samsung and experienced radiologist.
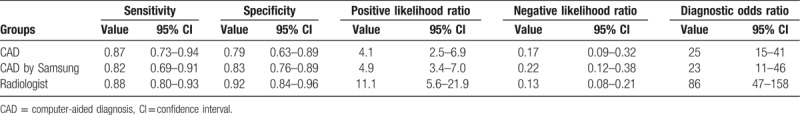
Figure 5.
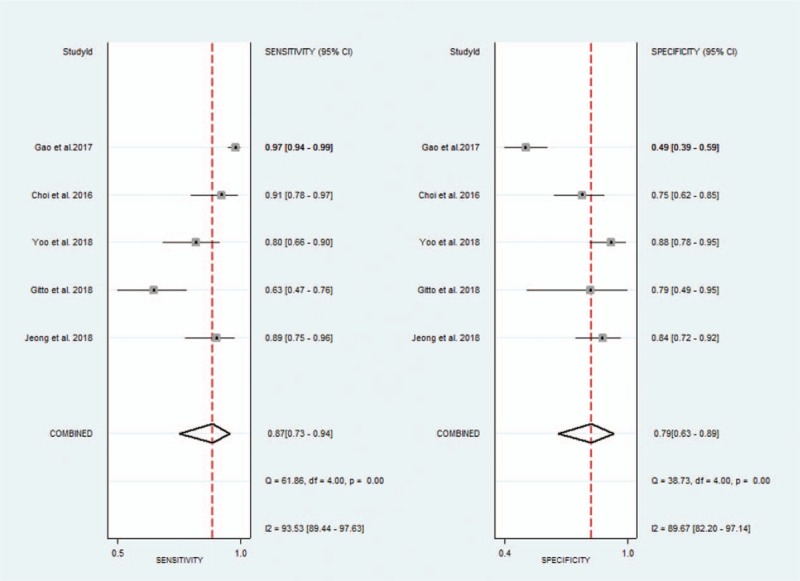
Forest plot of pooled sensitivity and specificity of computer-aided diagnosis system for the diagnosis of thyroid nodules.
Figure 7.
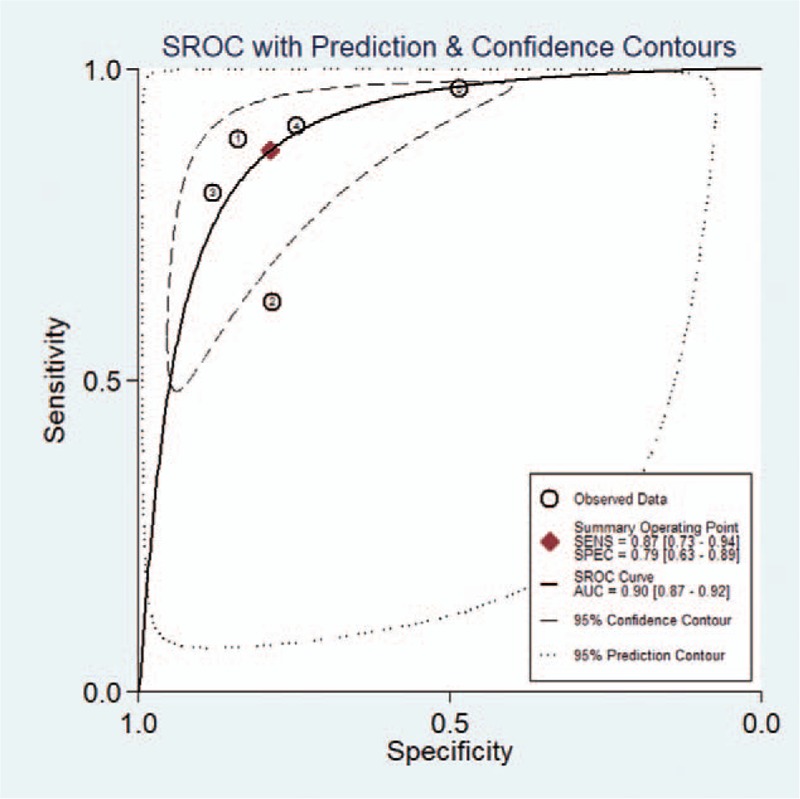
Summary receiver-operating characteristic (SROC) curves of computer-aided diagnosis system for the diagnosis of thyroid nodules.
Figure 6.
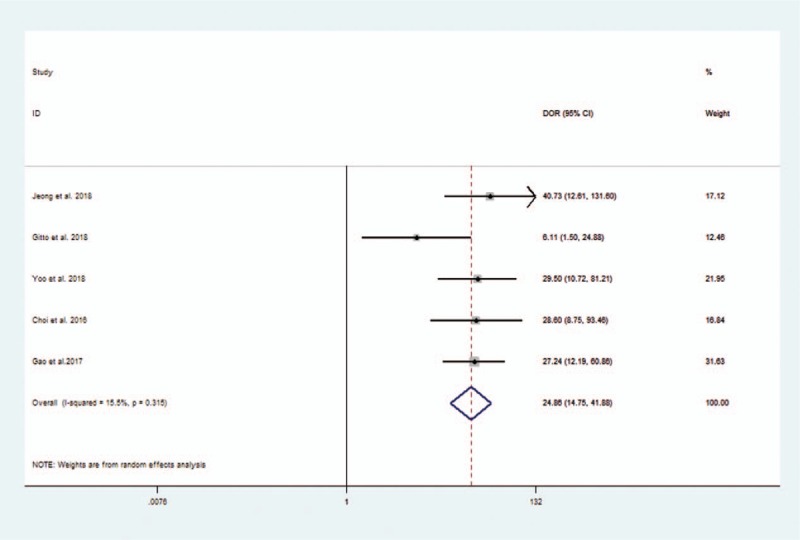
Forest plot of diagnostic odds ratio of computer-aided diagnosis system for the diagnosis of thyroid nodules.
The pooled sensitivity, specificity, positive likelihood ratio, negative likelihood ratio, and DOR for experienced radiologists were 0.88 (95% CI 0.80–0.93), 0.92 (95% CI 0.84–0.96), 11.1 (95% CI 5.6–21.9), 0.13 (95% CI 0.08–0.21), and 86 (95% CI 47–158), respectively. The Forest figures of sensitivity, specificity, and DOR of experienced radiologist are showed in Figures 8 and 9. The heterogeneity of sensitivity, specificity and DOR of experienced radiologist in the meta-analysis were showed as I2 = 81.66% (95% CI 66.25–97.06%), I2 = 84.25% (95% CI 71.51–96.98%), and I2 = 41.1% (P = .147), respectively. Figure 10 shows the SROC curve and indicates that the area under the curve was 0.96 (95% CI 0.94–0.97).
Figure 8.
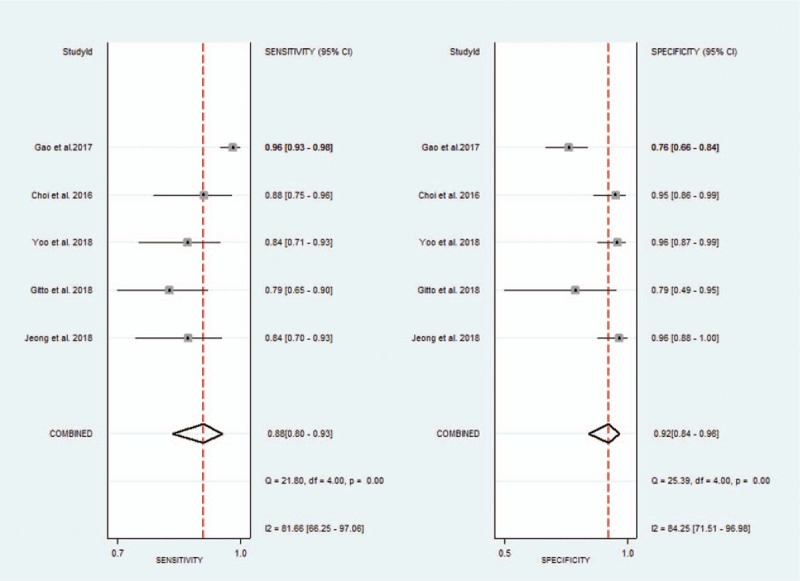
Forest plot of pooled sensitivity and specificity of experienced radiologists for the diagnosis of thyroid nodules.
Figure 10.
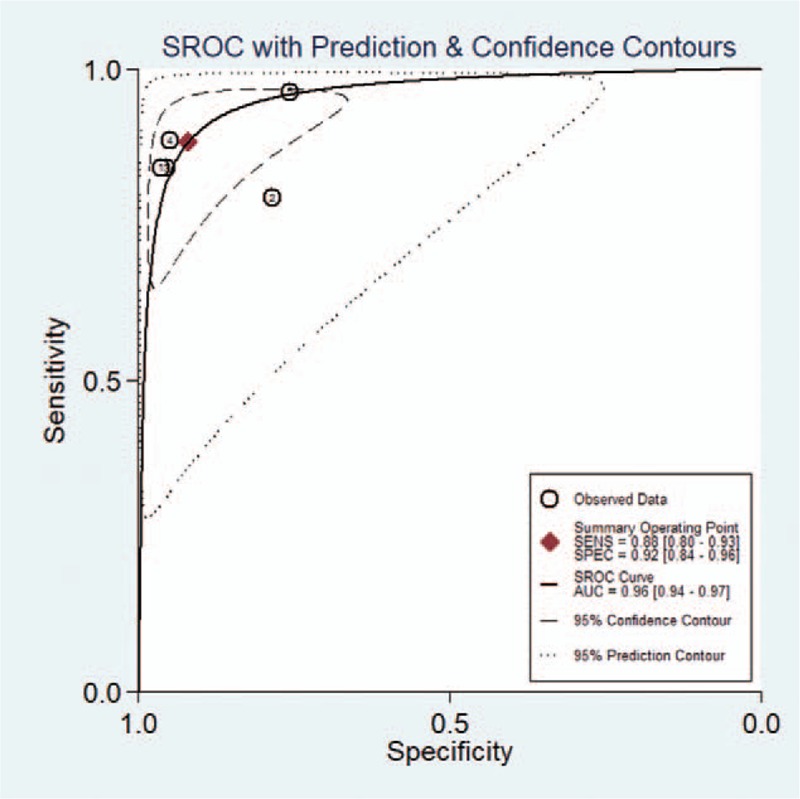
Summary receiver-operating characteristic (SROC) curves of experienced radiologists for the diagnosis of thyroid nodules.
Figure 9.
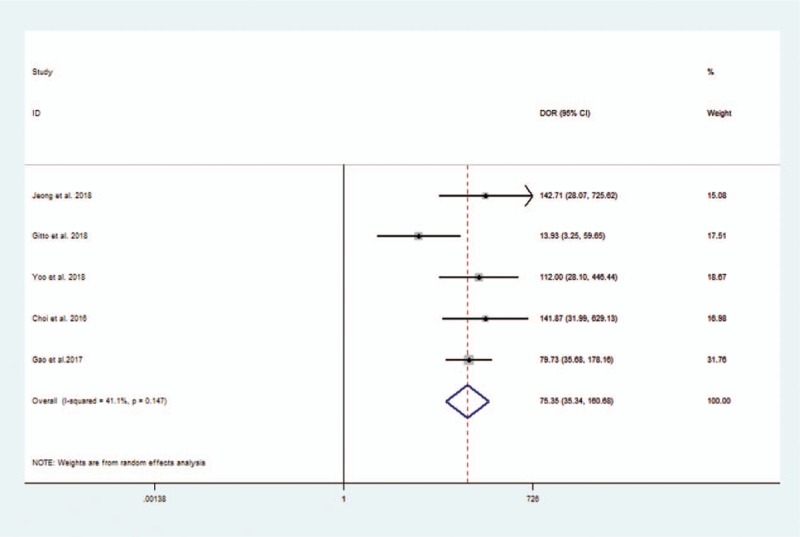
Forest plot of diagnostic odds ratio of experienced radiologists for the diagnosis of thyroid nodules.
Considering the heterogeneity, subgroup meta-analysis was also performed for CAD by Samsung (shown in Table 3). The pooled sensitivity, specificity, positive likelihood ratio, negative likelihood ratio, and DOR for experienced radiologist were 0.82 (95% CI 0.69–0.91), 0.83 (95% CI 0.76–0.89), 4.9 (95% CI 3.4–7.0), 0.22 (95% CI 0.12–0.38), and 23 (95% CI 11–46), respectively. The Forest figures of sensitivity, specificity and DOR of CAD system by Samsung are showed in Figures 11 and 12. The heterogeneity of sensitivity, specificity, and DOR of CAD system in the meta-analysis were showed as I2 = 79.62% (95% CI 59.70–99.54%), I2 = 27.52% (95% CI 0.00–98.84%), and I2 = 35.9% (P = .197), respectively. Figure 13 shows the SROC curve and indicated that the area under the curve was 0.88 (95% CI 0.85–0.91).
Figure 11.
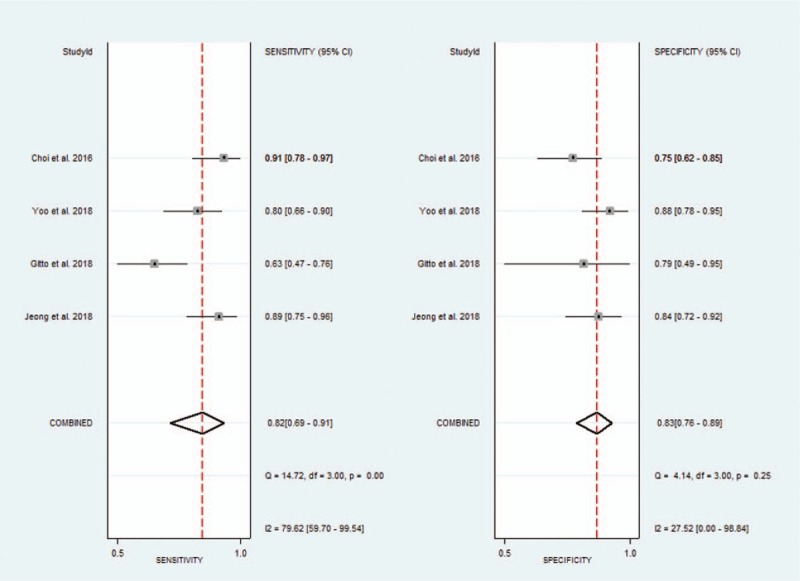
Forest plot of pooled sensitivity and specificity of computer-aided diagnosis system by Samsung for the diagnosis of thyroid nodules.
Figure 13.
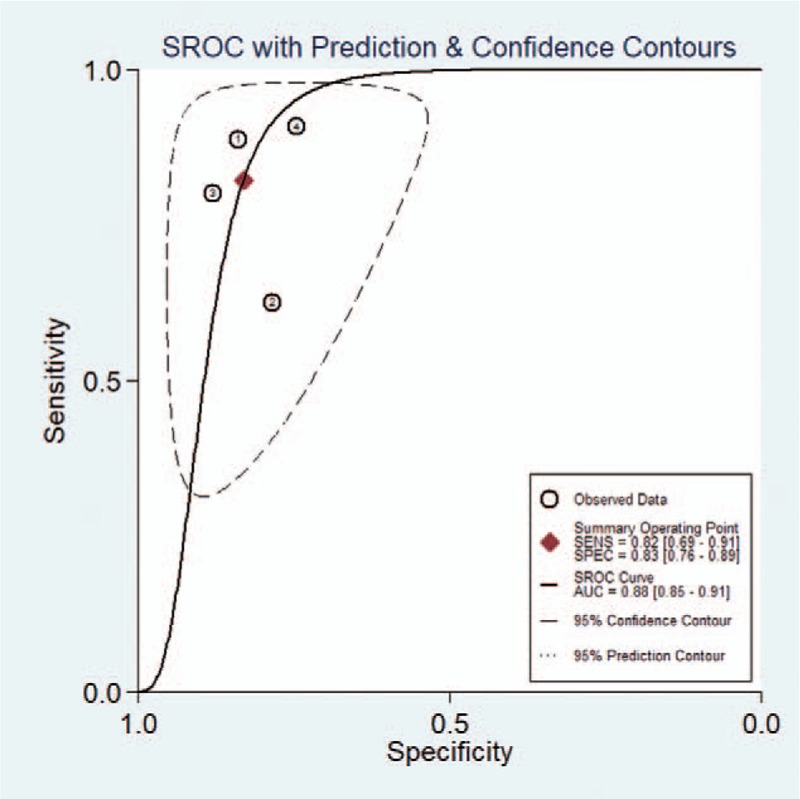
Summary receiver-operating characteristic (SROC) curves of computer-aided diagnosis system by Samsung for the diagnosis of thyroid nodules.
Figure 12.
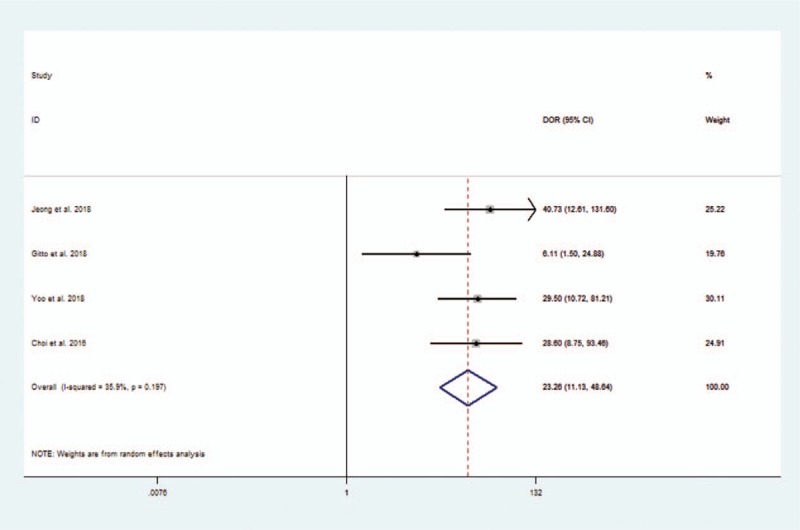
Forest plot of diagnostic odds ratio of computer-aided diagnosis system by Samsung for the diagnosis of thyroid nodules.
Meanwhile, a meta-regression analysis was also performed and showed that there was a lack of heterogeneity based on ethnicity, study design, and so on.
4. Discussion
Ultrasound, as a noninvasive and inexpensive imaging technique, is useful not only for detection but also for discrimination between benign and malignant thyroid nodules, which does not have any radioactive hazards and has a short acquisition time.[22,44] However, ultrasound has some limitations that the reliability of diagnosis depends on factors such as the quality of images and the expertise of radiologist who interprets the images, which is easily affected by echo perturbation and speckle noise.[45,46] Additionally, different types of benign and malignant nodules have different characteristics in an ultrasound image, which adds difficulties to the recognition.[10,47] Accurate determination of whether thyroid nodules are benign or malignant is necessary, which reduces patients’ risk and the significant medical costs with FNA or surgery.[48] Therefore, interpretation of ultrasound images can only be done by radiologists with lots of experience and training to ensure the accuracy. Meanwhile, more and more automated efficient ultrasound image analysis techniques,[49–52] such as ultrasound-based CAD, were developed to obtain accurate, reproducible, and objective diagnostic results. The current CAD systems mainly include 2 aspects of technology: the recognition of benign and malignant thyroid nodules and the recognition of thyroid boundary. Table 4 shows characteristics of some studies[14,24,36–40] on algorithms of CAD system. The concrete implementation flow of most existing CAD systems based on a neural network model is shown in Figure 14. Firstly, the classifiers are trained using the selected features and the ground truth of whether the image is benign or malignant. Secondly, the classifier training parameters are applied on the features selected from the test images to predict the class of the test image. Once, several test images are evaluated in such a way, then the predicted class labels are compared with the ground truth of the test images to calculate the classifier performance measures like accuracy, sensitivity, and specificity. Finally, the classifier resulting in the best accuracy is then chosen as the optimal classifier for future implementations of the CAD system.
Table 4.
Characteristics of some studies on algorithms of computer-aided diagnosis system.
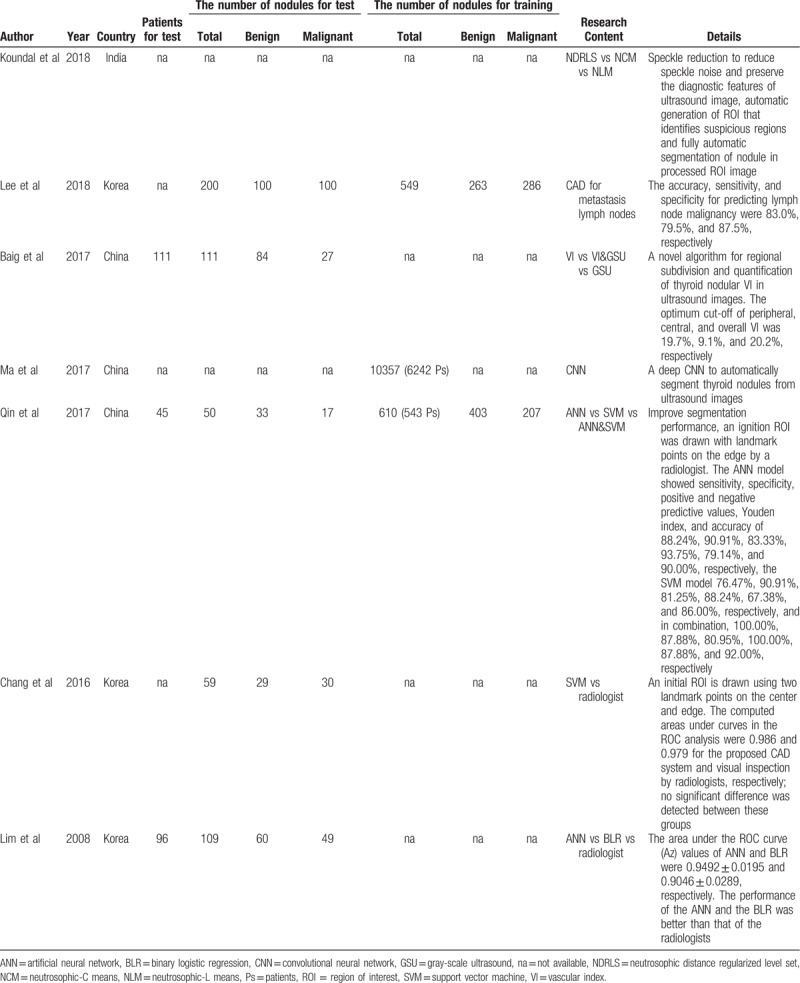
Figure 14.
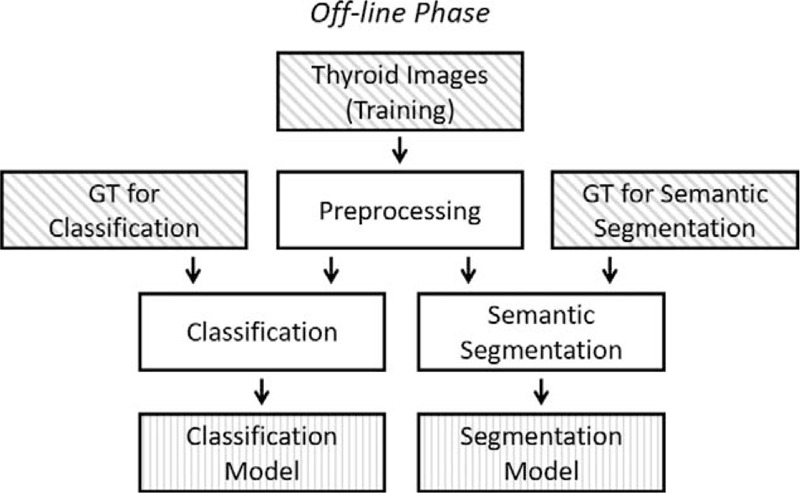
The concrete implementation flow of most existing computer-aided diagnosis systems based on neural network model.
So far, whether the diagnostic performance of existing CAD systems can reach the diagnostic level of experienced radiologists is still controversial. This study is the 1st meta-analysis study to evaluate the diagnostic value of CAD systems. The finding of this meta-analysis showed that the CAD system had similar sensitivity and negative likelihood ratio compared with experienced radiologists. However, the specificity, the positive likelihood ratio and DOR were relatively low. These results indicated that there was a clear gap between the CAD system and the experienced radiologist in diagnostic performance of thyroid nodules. Besides, the time required for postprocessing needs to be analyzed. Only Gitto et al[33] reported that the CAD system by Samsung cost four to 5 minutes for per thyroid nodule, which was much longer than radiologists. The unsatisfied time consumption was mainly related to the selection of segmented nodule among a series of candidates provided by the CAD system or to the need of manually modifying the contours of the lesion. It can be seen that segmentation of the existing CAD system also needs manual participation so it belongs to semi-intelligent products. Additionally, successful nodule segmentations were important and influenced the precision of recognition of nodules. Choi et al[31] reported that the successful nodule segmentations were observed in 87.3% (89/102) of nodules. Poor nodule segmentation occurred more frequently with benign nodules (n = 11, 18.6%) than with malignant nodules (n = 2, 4.7%) and the difference was statistically significant (P = .04). Among those nodules with poor segmentation, 54.6% of the benign nodules (6/11) were also diagnosed as malignant, while all of malignant nodules were diagnosed as malignant. Thus, it can be seen that poor segmentation on CAD system may increase the FP rate without affection on the FN rate.
The CAD system still has a long way to go to replace experienced radiologists in the process of improving accuracy and reducing time consumption. The existing CAD system's standpoint is to assist radiologists to diagnose the thyroid nodule. Yoo et al[34] confirmed that the CAD system-assisted radiologist yielded a higher diagnostic sensitivity than the radiologist alone, which implied that the CAD system allowed the radiologist to detect a higher proportion of genuine malignancies.
Regarding the interobserver agreement for the ultrasound characteristics,[53–55] there was a good agreement for most of the US descriptors between the CAD system and radiologists. However, Jeong et al[35] found that the CAD system's interpretation of margin and composition failed to match the experienced radiologists. Besides, Choi et al[31] also reported that fail agreement was found for the margin definitions between the 2. For margin descriptors, it may depend on the semi-automated CAD system's step for the margin descriptors, which requires experience of the operators. Additionally, the current CAD system still has some limitations regarding the interpretation of compositions. Jeong et al[35] reported that solid nodules with a marked hypoechoic or hypoechoic component were commonly misinterpreted as a partially cystic or partially solid nodule. Therefore, further validation pertaining to this issue and an assessment based on a larger study are required to improve the current CAD system.
The strength of this systematic review is that we included adequate studies in the literature available for meta-analysis. However, our study also had several limitations. Firstly, the current meta-analysis showed a considerable heterogeneity of sensitivity and specificity among studies. This heterogeneity is likely to arise through diversity in methodologic aspects among different studies, and the basic differences among the patients in the included studies may also have contributed to the observed heterogeneity of the results. However, in sub-meta-analysis and meta-regression analysis of the current review, the interpretation criteria in this study did not possess some sources of heterogeneity. To minimize bias in the selection of studies and the data extraction, reviewers who were blinded to the journal, author, institution, and date of publication independently selected articles based on the inclusion criteria, and scores were assigned to study design characteristics and examination results by using a standardized form that was based on the QUADAS-2. Secondly, the sample size of included studies was relatively small. Therefore, selection bias may have been present. Thirdly, for the small number of thyroid nodules, the gap between benign group and malignant group is large, which would increase measure bias. Additionally, publication bias is a major concern in all meta-analyses as studies reporting significant findings are more likely to be published than those reporting nonsignificant results. However, we assessed the publication bias in our analysis by using Deek funnel plot which showed no definite asymmetry.
In conclusion, the sensitivity of the CAD system in thyroid nodules was similar to that of experienced radiologists. However, the CAD system had lower specificity and DOR than the experienced radiologist. Larger sample-size prospective studies need be warranted to evaluate the diagnostic performance of CAD system further. The CAD system may play the potential role as a decision-making assistant alongside radiologists in the thyroid nodules’ diagnosis. Future technical improvements in the image segmentation and recognition, which also includes automatic detection of characteristics such as nodule calcification, would be helpful to increase the accuracy as well as diagnostic efficiency.
Acknowledgments
WJZ acknowledges funding from the Postdoctoral Sustentation Fund of West China Hospital, Sichuan University, China (Grant No. 18HXBH074).
Author contributions
Conceptualization: Wan-Jun Zhao.
Data curation: Lin-Ru Fu, Zhi-Mian Huang.
Formal analysis: Wan-Jun Zhao.
Investigation: Lin-Ru Fu, Zhi-Mian Huang.
Methodology: Wan-Jun Zhao.
Project administration: Wan-Jun Zhao.
Resources: Lin-Ru Fu, Zhi-Mian Huang.
Supervision: Wan-Jun Zhao.
Writing – original draft: Wan-Jun Zhao, Lin-Ru Fu.
Writing – review & editing: Jing-Qiang Zhu, Bu-Yun Ma.
Lin-Ru Fu orcid: 0000-0001-6368-5578.
Footnotes
Abbreviations: AI = artificial intelligence, ATA = American Thyroid Association, AUC = area under the receiver-operating characteristic, CAD = computer-aided diagnosis, CI = confidence interval, DOR = diagnostic odds ratio, FN = false negative, FNA= fine-needle aspiration, FP = false positive, QUADAS-2 = Quality Assessment of Diagnostics Accuracy Studies-2, SROC = summary receiver-operating characteristic, TN = true negative, TP = true positive, TIRADS = Thyroid Imaging Reporting and Data System.
This study was funded by the Postdoctoral Sustentation Fund of West China Hospital, Sichuan University, China (Grant No. 18HXBH074).
The authors have no conflicts of interest to disclose.
References
- [1].Guth S, Theune U, Aberle J, et al. Very high prevalence of thyroid nodules detected by high frequency (13 MHz) ultrasound examination. Eur J Clin Invest 2010;39:699–706. [DOI] [PubMed] [Google Scholar]
- [2].Wolinski K, Stangierski A, Ruchala M. Comparison of diagnostic yield of core-needle and fine-needle aspiration biopsies of thyroid lesions: systematic review and meta-analysis. Eur Radiol 2017;27:431–6. [DOI] [PMC free article] [PubMed] [Google Scholar]
- [3].Siegel RL, Miller KD, Jemal A. Cancer statistics, 2018. CA Cancer J Clin 2018;68:7–30. [DOI] [PubMed] [Google Scholar]
- [4].Xiaoyi L, General Do. The interpretation of 2015 American Thyroid Association Management Guidelines for Adult Patients with Thyroid Nodules and Differentiated Thyroid Cancer: surgery part. China Oncol 2017;52:309–15. [DOI] [PubMed] [Google Scholar]
- [5].Haugen BR, Alexander EK, Bible KC, et al. 2015 American Thyroid Association Management Guidelines for Adult Patients with Thyroid Nodules and Differentiated Thyroid Cancer: The American Thyroid Association Guidelines Task Force on Thyroid Nodules and Differentiated Thyroid Cancer. Thyroid 2016;26:1–33. [DOI] [PMC free article] [PubMed] [Google Scholar]
- [6].Gharib H, Papini E, Garber JR, et al. American Association of Clinical Endocrinologists, American College of Endocrinology, and Associazione Medici Endocrinologi Medical Guidelines for Clinical Practice for the Diagnosis and Management of Thyroid Nodules--2016 Update. Endocr Pract 2016;22:622–39. [DOI] [PubMed] [Google Scholar]
- [7].Moon WJ, Jung SL, Lee JH, et al. Benign and malignant thyroid nodules: US differentiation--multicenter retrospective study. Radiology 2008;247:762–70. [DOI] [PubMed] [Google Scholar]
- [8].Mainini AP, Monaco C, Pescatori LC, et al. Image-guided thermal ablation of benign thyroid nodules. J Ultrasound 2016;20:11–22. [DOI] [PMC free article] [PubMed] [Google Scholar]
- [9].Mauri G, Nicosia L, Della Vigna P, et al. Percutaneous laser ablation for benign and malignant thyroid diseases. Ultrasonography (Seoul, Korea) 2019;38:25–36. [DOI] [PMC free article] [PubMed] [Google Scholar]
- [10].Park CS, Kim SH, Jung SL, et al. Observer variability in the sonographic evaluation of thyroid nodules. J Clin Ultrasound 2010;38:287–93. [DOI] [PubMed] [Google Scholar]
- [11].Park SH, Kim SJ, Kim EK, et al. Interobserver agreement in assessing the sonographic and elastographic features of malignant thyroid nodules. Am J Roentgenol 2009;193:W416–23. [DOI] [PubMed] [Google Scholar]
- [12].Park SJ, Park SH, Choi YJ, et al. Interobserver variability and diagnostic performance in US assessment of thyroid nodule according to size. Ultraschall in Der Medizin 2012;33:E186–90. [DOI] [PubMed] [Google Scholar]
- [13].Choi SH, Kim EK, Kwak JY, et al. Interobserver and intraobserver variations in ultrasound assessment of thyroid nodules. Thyroid 2010;20:167–72. [DOI] [PubMed] [Google Scholar]
- [14].Chang Y, Paul AK, Kim N, et al. Computer-aided diagnosis for classifying benign versus malignant thyroid nodules based on ultrasound images: a comparison with radiologist-based assessments. Med Phys 2016;43:554. [DOI] [PubMed] [Google Scholar]
- [15].Acharya UR, Sree SV, Krishnan MM, et al. Computer-aided diagnostic system for detection of Hashimoto thyroiditis on ultrasound images from a Polish population. J Ultrasound Med 2014;33:245–53. [DOI] [PubMed] [Google Scholar]
- [16].Zhang P, Xu X, Wang H, et al. Computer-aided lung cancer diagnosis approaches based on deep learning. J Comput Aided Design Comput Graph 2018;30:90. [Google Scholar]
- [17].Paulraj T, Chellliah KSV. Computer-aided diagnosis of lung cancer in computed tomography scans: a review. Curr Med Imag Rev 2018;14:374–88. [Google Scholar]
- [18].Narayanan BN, Hardie RC, Kebede TM. Performance analysis of a computer-aided detection system for lung nodules in CT at different slice thicknesses. J Med Imaging (Bellingham) 2018;5:014504. [DOI] [PMC free article] [PubMed] [Google Scholar]
- [19].Mohebian MR, Marateb HR, Mansourian M, et al. A hybrid computer-aided-diagnosis system for prediction of breast cancer recurrence (HPBCR) using optimized ensemble learning. Comput Struct Biotechnol J 2017;15:75–85. [DOI] [PMC free article] [PubMed] [Google Scholar]
- [20].Ertas G, Doran SJ, Leach MO. A computerized volumetric segmentation method applicable to multi-centre MRI data to support computer-aided breast tissue analysis, density assessment and lesion localization. Med Biol Eng Comput 2017;55:57–68. [DOI] [PMC free article] [PubMed] [Google Scholar]
- [21].Ardakani AA, Gharbali A, Mohammadi A. Classification of benign and malignant thyroid nodules using wavelet texture analysis of sonograms. J Ultrasound Med 2015;34:1983–9. [DOI] [PubMed] [Google Scholar]
- [22].Acharya UR, Swapna G, Sree SV, et al. A review on ultrasound-based thyroid cancer tissue characterization and automated classification. Technol Cancer Res Treat 2014;13:289–301. [DOI] [PubMed] [Google Scholar]
- [23].Garg H, Jindal A. Segmentation of thyroid gland in ultrasound image using neural network. Paper presented at: International Conference on Computing, 2013. [Google Scholar]
- [24].Lim KJ, Choi CS, Yoon DY, et al. Computer-aided diagnosis for the differentiation of malignant from benign thyroid nodules on ultrasonography. Acad Radiol 2008;15:853–8. [DOI] [PubMed] [Google Scholar]
- [25].Chen D, Niu J, Qiao P, et al. A deep-learning based ultrasound text classifier for predicting benign and malignant thyroid nodules. Paper presented at: International Conference on Green Informatics, 2017. [Google Scholar]
- [26].Whiting PF, Rutjes AWS, Westwood ME, et al. QUADAS-2: a revised tool for the quality assessment of diagnostic accuracy studies. Ann Int Med 2011;155:529–36. [DOI] [PubMed] [Google Scholar]
- [27].Glas AS, Lijmer JG, Prins MH, et al. The diagnostic odds ratio: a single indicator of test performance. J Clin Epidemiol 2003;56:1129–35. [DOI] [PubMed] [Google Scholar]
- [28].Reitsma JB, Glas AS, Rutjes AW, et al. Bivariate analysis of sensitivity and specificity produces informative summary measures in diagnostic reviews. J Clin Epidemiol 2005;58:982–90. [DOI] [PubMed] [Google Scholar]
- [29].Rutter CM, Gatsonis CA. A hierarchical regression approach to meta-analysis of diagnostic test accuracy evaluations. Stat Med 2010;20:2865–84. [DOI] [PubMed] [Google Scholar]
- [30].Deeks JJ, Macaskill P, Irwig L. The performance of tests of publication bias and other sample size effects in systematic reviews of diagnostic test accuracy was assessed. J Clin Epidemiol 2005;58:882–93. [DOI] [PubMed] [Google Scholar]
- [31].Choi YJ, Baek JH, Park HS, et al. A computer-aided diagnosis system using artificial intelligence for the diagnosis and characterization of thyroid nodules on ultrasound: initial clinical assessment. Thyroid 2017;27:546–52. [DOI] [PubMed] [Google Scholar]
- [32].Gao L, Liu R, Jiang Y, et al. Computer-aided system for diagnosing thyroid nodules on ultrasound: a comparison with radiologist-based clinical assessments. Head Neck 2017;40:778–83. [DOI] [PubMed] [Google Scholar]
- [33].Gitto S, Grassi G, De Angelis C, et al. A computer-aided diagnosis system for the assessment and characterization of low-to-high suspicion thyroid nodules on ultrasound. Radiol Med 2019;124:118–25. [DOI] [PubMed] [Google Scholar]
- [34].Yoo YJ, Ha EJ, Cho YJ, et al. Computer-aided diagnosis of thyroid nodules via ultrasonography: initial clinical experience. Korean J Radiol 2018;19:665–72. [DOI] [PMC free article] [PubMed] [Google Scholar]
- [35].Jeong EY, Kim HL, Ha EJ, et al. Computer-aided diagnosis system for thyroid nodules on ultrasonography: diagnostic performance and reproducibility based on the experience level of operators. Eur Radiol 2019;29:1978–85. [DOI] [PubMed] [Google Scholar]
- [36].Baig FN, Lunenburg JTJV, Liu SYW, et al. Computer-aided assessment of regional vascularity of thyroid nodules for prediction of malignancy. Sci Rep 2017;7:14350. [DOI] [PMC free article] [PubMed] [Google Scholar]
- [37].Hoon LJ, Hwan BJ, Han KJ, et al. Deep learning-base d computer-aided diagnosis system for localization and diagnosis of metastatic lymph nodes on ultrasound: a pilot study. Thyroid 2018;28:1332–8. [DOI] [PubMed] [Google Scholar]
- [38].Ma J, Wu F, Jiang TA, et al. Ultrasound image-based thyroid nodule automatic segmentation using convolutional neural networks. Int J Comput Assist Radiol Surg 2017;12:1895–910. [DOI] [PubMed] [Google Scholar]
- [39].Maroulis DE, Savelonas MA, Karkanis SA, et al. Computer-aided thyroid nodule detection in ultrasound images. Proceedings of the IEEE Symposium on Computer-Based Medical Systems, 2005:271–276. [Google Scholar]
- [40].Yu Q, Jiang T, Zhou A, et al. Computer-aided diagnosis of malignant or benign thyroid nodes based on ultrasound images. Eur Arch Otorhinolaryngol 2017;274:2891–7. [DOI] [PubMed] [Google Scholar]
- [41].Choi WJ, Park JS, Kim KG, et al. Computerized analysis of calcification of thyroid nodules as visualized by ultrasonography. Eur J Radiol 2015;84:1949–53. [DOI] [PubMed] [Google Scholar]
- [42].Lin YH, Tsai YC, Lin KJ, et al. Computer-aided diagnostic technique in 2-deoxy-2-[(18)F]fluoro-D-glucose-positive thyroid nodule: clinical experience of 74 non-thyroid cancer patients. Ultrasound Med Biol 2019;45:108–21. [DOI] [PubMed] [Google Scholar]
- [43].Zhu LC, Ye YL, Luo WH, et al. A model to discriminate malignant from benign thyroid nodules using artificial neural network. PLoS One 2013;8:e82211. [DOI] [PMC free article] [PubMed] [Google Scholar]
- [44].Al NA, Gionfriddo MR, Javed A, et al. Accuracy of thyroid nodule sonography for the detection of thyroid cancer in children: systematic review and meta-analysis. Clin Endocrinol 2016;84:423–30. [DOI] [PubMed] [Google Scholar]
- [45].Ivanac G, Brkljacic B, Ivanac K, et al. Vascularisation of benign and malignant thyroid nodules: CD US evaluation. Ultraschall in Der Medizin 2007;28:502–6. [DOI] [PubMed] [Google Scholar]
- [46].Sipos JA. Advances in ultrasound for the diagnosis and management of thyroid cancer. Thyroid 2009;19:1363–72. [DOI] [PubMed] [Google Scholar]
- [47].Bastin S, Bolland MJ, Croxson MS. Role of ultrasound in the assessment of nodular thyroid disease. J Med Imaging Radiat Oncol 2010;53:177–87. [DOI] [PubMed] [Google Scholar]
- [48].Gamme G, Parrington T, Wiebe E, et al. The utility of thyroid ultrasonography in the management of thyroid nodules. Can J Surg 2017;60:134–9. [DOI] [PMC free article] [PubMed] [Google Scholar]
- [49].Caresio C, Caballo M, Deandrea M, et al. Quantitative analysis of thyroid tumors vascularity: a comparison between 3-D contrast-enhanced ultrasound and 3-D Power Doppler on benign and malignant thyroid nodules. Med Phys 2018;45:3173–84. [DOI] [PubMed] [Google Scholar]
- [50].Jin XZ, Lu WW, Zhang HF, et al. Comparative study on the diagnostic values of different ultrasound technologies for malignant thyroid nodules. Oncol Lett 2018;16:910–4. [DOI] [PMC free article] [PubMed] [Google Scholar]
- [51].Lang HH, Woo YC, Chiu WH. Role of second high-intensity focused ultrasound (HIFU) treatment for unsatisfactory benign thyroid nodules after first treatment. Eur Radiol 2018;29:1469–78. [DOI] [PubMed] [Google Scholar]
- [52].Wang Y, Wei K, Wan P. A method of ultrasonic image recognition for thyroid papillary carcinoma based on deep convolution neural network. Neuroquantology 2018;16:757–68. [Google Scholar]
- [53].Milas M, Mandel SJ, Langer JE, et al. Advanced Thyroid and Parathyroid Ultrasound [M]. 2017;Switzerland: Springer International Publishing, 179–194. [Google Scholar]
- [54].Kabaker AS, Tublin ME, Nikiforov YE, et al. Suspicious ultrasound characteristics predict BRAFV600E-positive papillary thyroid carcinoma. Thyroid 2012;22:585–9. [DOI] [PMC free article] [PubMed] [Google Scholar]
- [55].Smithbindman R, Lebda P, Feldstein VA, et al. Risk of thyroid cancer based on thyroid ultrasound imaging characteristics: results of a population-based study. JAMA Intern Med 2013;173:1788–96. [DOI] [PMC free article] [PubMed] [Google Scholar]