Supplemental Digital Content is available in the text
Keywords: cardiovascular disease, cardiovascular mortality, glycemic variability, mortality
Abstract
Increased glycemic variability (GV) is an independent risk factor for cardiovascular complications in patients with diabetes. We evaluated the risk of future development of cardiovascular disease (CVD) and death according to GV in a general population without diabetes.
We used the National Health Insurance Service, providing a population-based, nationwide database of Koreans. We included individuals without diabetes who underwent glucose measurement at least 3 times during 2002 to 2006. GV was calculated as standard deviation (SD) of fasting plasma glucose (FPG) levels. We observed development of CVD or all-cause death from 2007 to 2015, and also evaluated the mortality within 1 year after CVD.
Among 3,211,319 people, we found 23,374 incident cases of myocardial infarction (MI), 27,705 cases of stroke, and 63,275 deaths during 8.3 years of follow-up. After multivariate adjustment, GV was found to be a significant predictor of MI, stroke and all-cause death for their highest quartile, with corresponding hazard ratios (HR) of 1.08 (95% confidence interval, CI 1.04–1.11), 1.09 (95% CI 1.06–1.13), and 1.12 (95% CI 1.10–1.15), respectively. The risk of death increased more in those who had both impaired fasting glucose and the highest quartile of GV (HR 1.24 [95% CI 1.21–1.28]). Moreover, early death rate after 1 year of CVD was higher in the highest quartile of GV compared to the lowest quartile (HR 1.21 [95% CI 1.03–1.41]).
Long-term FPG variation was independently associated with CVD and mortality in a general population without diabetes.
1. Introduction
Glycemic variability (GV) is fluctuation between high and low glucose levels and is a component of dysglycemia. In both type 1 and type 2 diabetes mellitus, prospective clinical studies show strong correlations between mean blood glucose values and diabetic complications.[1,2] GV is postulated to also contribute to development of diabetes complications.[3] Postprandial hyperglycemia has a harmful effect on the onset of cardiovascular complications in people with diabetes or impaired glucose tolerance (IGT).[4] The study to prevent type 2 diabetes (STOP-Noninsulin-Dependent Diabetes Mellitus [NIDDM] trial) demonstrated that decreasing postprandial plasma glucose level in patients with IGT using acarbose reduces risk of cardiovascular disease (CVD).[5] Studies have shown that GV might be important for the pathogenesis of atherosclerosis and could be an independent risk factor for cardiovascular complications in patients with diabetes.[6,7]
Short-term GV refers to within or between-day fluctuations in an individual and is usually measured by continuous glucose monitoring system.[8] On the other hand, long-term GV refers to glycemic fluctuations over months to years and is generally measured by visit-to-visit variability in either fasting plasma glucose (FPG) or glycated hemoglobin (HbA1c).[9] Long-term FPG or HbA1c variability is positively associated with microvascular and macrovascular complications and mortality independent of HbA1c level in patients with type 1 and type 2 diabetes.[8,10,11]
Intermittent high glucose level is reported to stimulate reactive oxygen species overproduction, leading to increased cellular apoptosis in human umbilical vein endothelial cells compared with cells in a stable high glucose environment.[12] Oscillating glucose compared to constant high glucose results in more deleterious effects on endothelial function and oxidative stress in people with and without type 2 diabetes.[13] These findings suggest that glucose fluctuations might be involved in development of vascular injury.
Although GV increases in people with diabetes or impaired blood glucose regulation, a certain degree of variability is also observed in people with normal glucose tolerance (NGT).[14,15] A study[16] found significant increases in GV with aging in a general adult population. However, the prognostic implications of long-term GV in people without diabetes have not been investigated in a population-based study. Therefore, we evaluated the risk of future development of CVD and death for a general population and the risk of death 1 year after development of CVD according to variation in FPG in individuals without diabetes. We used the National Health Insurance Service (NHIS), which is a population-based database of a nationwide cohort.
2. Methods
2.1. Study population
The NHIS has information about health insurance utilization and periodic health examinations that cover almost all Korean adults.[17] The NHIS is a mandatory, government-operated, social health insurance program that covers about 97% of the Korean population. The remaining 3% are covered by the medical aid program. The NHIS in Korea is a comprehensive set of health information including around 50 million Koreans with eligibility, health examination database, medical treatment, and medical care institution databases.[17,18] NHIS contains claims and mortality data and is open to any researchers whose protocols are approved by both an NHIS review committee and an Institutional Review Board (IRB). The Korea University IRB approved the study protocol in accordance with the Declaration of Helsinki of the World Medical Association.
The NHIS recommends that all eligible Korean adults and their dependents undergo a standardized health examination if they are insured employees or self-employed and over the age of 40. The examination is recommended to occur at least biennially. Anthropometric and laboratory measurements include fasting glucose, lipid profile, creatinine, liver enzymes, and urinalysis. Health-related behavioral variables such as smoking, alcohol consumption, physical activity, and detailed medical history are gathered. Blood samples are collected after an overnight fast, and quality control procedures follow the Korean Association of Laboratory Quality Control.
From a database of 16,094,237 Korean residents who participated in at least 1 health examination provided by the NHIS, we selected 3,691,136 subjects who underwent glucose measurements at least 3 times during 2002 to 2006. It has been measured an average of 4.2 ± 1.2 times (median 4) per participant. We excluded people who had been diagnosed with diabetes (n = 279,141) or with CVD (n = 21,897) between 2002 and 2006, or missing information (n = 178,749) or aged <20 years (n = 30). As a result, a total of 3,211,319 subjects were analyzed in this study (Supplementary Fig. 1). We observed the development of CVD or all-cause death from 2007 to 2015.
To examine the effect of GV on the prognosis of incident CVD, we analyzed people who developed CVD during follow-up and underwent a glucose measurement during the year before the incident CVD. They should have at least 2 more blood glucose measurements over 5 years before CVD development. Therefore, records on 24,031 people were analyzed. We examined mortality 1 month and 1 year after the CVD event.
2.2. Outcome ascertainment and definition
We examined myocardial infarction (MI), stroke, and all-cause mortality as primary outcomes. Diagnosis of MI was defined using the International Classification of Diseases, 10th revision (ICD-10) codes (I21–I22) and admission records. Diagnosis of stroke was based on ICD-10 codes (I63–I64), computed tomography or magnetic resonance imaging claim data, and admission records. We also examined mortality from all causes. Impaired fasting glucose (IFG) was defined as FPG ≥6.1 mmol/L. The presence of diabetes was defined using the criterion of fasting glucose ≥7.0 mmol/L or presence of at least 1 claim per year for prescription of antidiabetic medication based on ICD-10 codes (E11–E14). The presence of hypertension was defined using criteria of systolic/diastolic blood pressure ≥140/90 mm Hg or presence of at least 1 claim per year for prescription of an antihypertensive agent using ICD-10 codes (I10–I15). The presence of dyslipidemia was defined using the criteria of total cholesterol ≥6.21 mmol/L or presence of at least 1 claim per year for prescription of an antihyperlipidemic agent using ICD-10 codes (E78).
2.3. Measurements
Body mass index (BMI) was calculated as weight (kg) divided by height squared (m2). At the time of weight measurement, systolic and diastolic pressure were also measured; serum samples for fasting glucose, hemoglobin, and total cholesterol levels were obtained at examination sites after overnight fast. Detailed histories of smoking status, alcohol consumption, and physical activity were obtained via questionnaire. Questionnaires at health examinations categorized smoking status as nonsmokers, ex-smokers, or current smoker and alcohol use as 0, 1 to 2, or ≥3 times/week. Participants were graded as exercising 0, 1 to 4, or ≥5 times/week. Income level was dichotomized at the lower 10%.
2.4. Statistical analysis
Data are expressed as mean ± standard deviation (SD) or percentage. Differences between groups were analyzed using Student t-test or Chi-squared test to assess differences in the distribution of categorical variables. SD of FPG was calculated only when more than 3 FPG measurements were performed. Participants were grouped into quartiles according to FPG-SD. Incidence or mortality rate per 1000 person-years, Kaplan–Meier curves, and adjusted hazard ratio (HR) were analyzed according to FPG-SD quartiles. To see the joint effect of FPG-SD and IFG, we collapsed the first, second, and third quartiles (Q1–3) of FPG-SD into a single group for participants with NGT or IFG. We conducted a 4-group comparison to calculate HRs for MI, stroke, and all-cause death for Q1–3 and Q4 for the NGT and IFG groups. A multiple Cox proportional hazard model was used after adjusting for age, sex, BMI, smoking status, alcohol drinking, exercise, dyslipidemia, hypertension, and FPG or the change of FPG level between 2002 and 2006 (ΔFPG). Forest plots for incident MI, stroke, and mortality according to risk factor subgroups were evaluated. A P < .05 was considered statistically significant. All statistical analyses used SAS software package version 9.3 (SAS Institute Inc, Cary, NC).
3. Results
Table 1 shows baseline demographic and clinical characteristics of participants grouped according to FPG-SD quartile. The mean FPG-SD value (median, minimum, maximum) of each quartile group was 2.55 (2.83, 0.00, and 4.50), 6.07 (6.10, 4.51, and 7.68), 9.38 (9.22, 7.68, and 11.32), and 15.76 (14.71, 11.32, and 55.15) mg/dL, respectively. Higher FPG-SD was associated with higher proportions of current smokers, heavy drinkers, and men. During an average 8.3 years of follow-up, we observed 23,374 incident occurrences of MI, giving a crude incidence rate of 0.88/1000 person-years; 27,705 of stroke, an incidence rate of 1.04/1000 person-years; 63,275 of all-cause death, a mortality rate of 2.37/1000 person-years.
Table 1.
Baseline characteristics according to quartiles of fasting plasma glucose standard deviation.
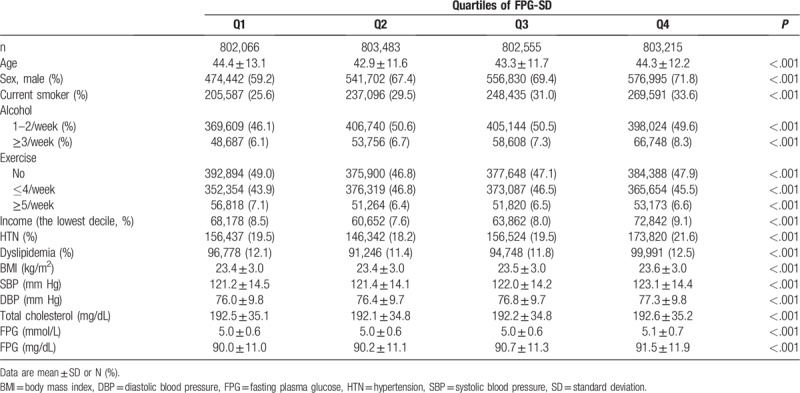
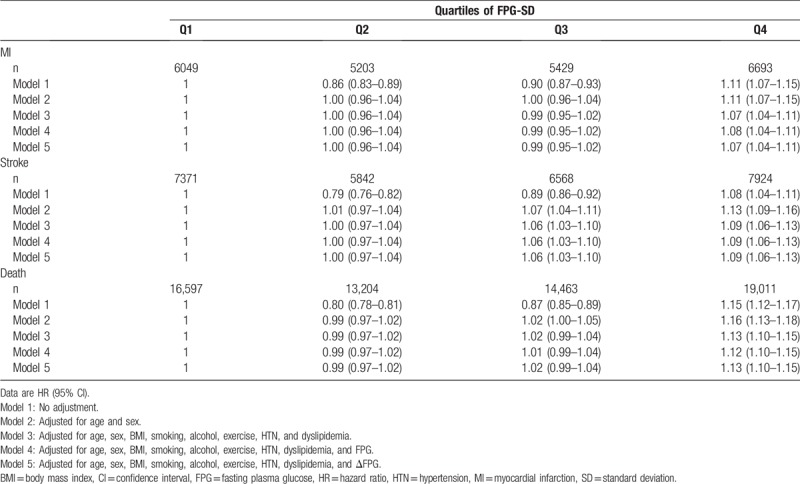
Table 2 shows HRs for MI, stroke, and all-cause death grouped by FPG-SD quartile. After adjustment for age, sex, BMI, smoking, alcohol, exercise, hypertension, dyslipidemia, and FPG, HRs for the highest FPG-SD quartile was 1.08 (95% CI 1.04–1.11) for MI, 1.09 (95% CI 1.06–1.13) for stroke, and 1.12 (95% CI 1.10–1.15) for all-cause death compared to the lowest FPG-SD quartile. In model 5, the results were similar even after further adjustment for the change of FPG level.
Table 2.
Hazard ratios for death, myocardial infarction, and stroke according to quartiles of fasting plasma glucose standard deviation.
Figures present the Kaplan–Meier cumulative risk for MI (Fig. 1), stroke (Fig. 2), and all-cause death (Fig. 3) according to FPG-SD quartile. People in the highest quartile showed a higher risk for MI, stroke, and all-cause death than those in the lowest quartile of FPG-SD (log-rank test P < .001, Figs. 1–3).
Figure 1.
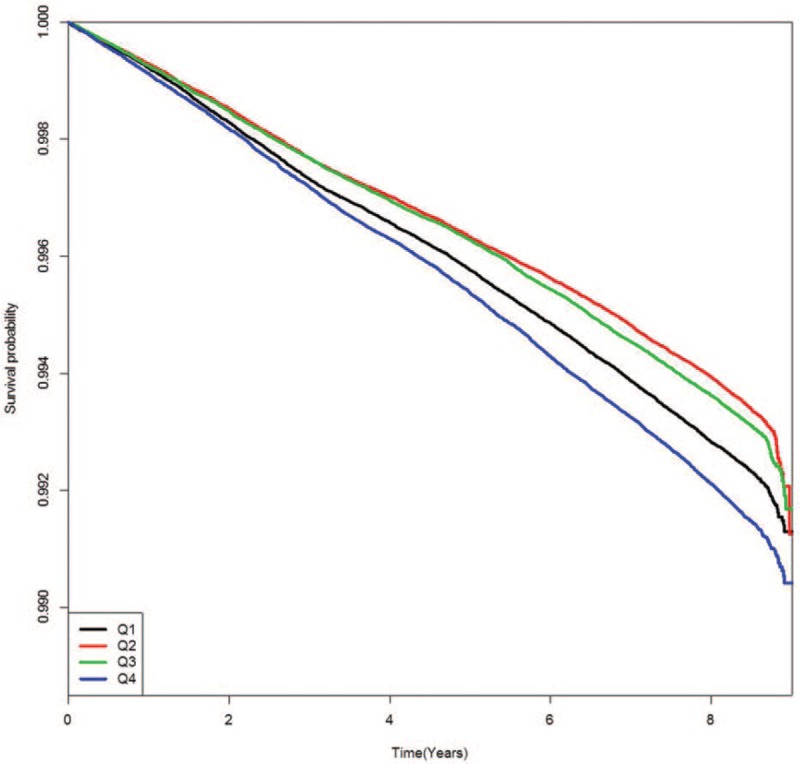
Kaplan–Meier event-free survival curves for myocardial infarction according to glycemic variability quartile.
Figure 2.
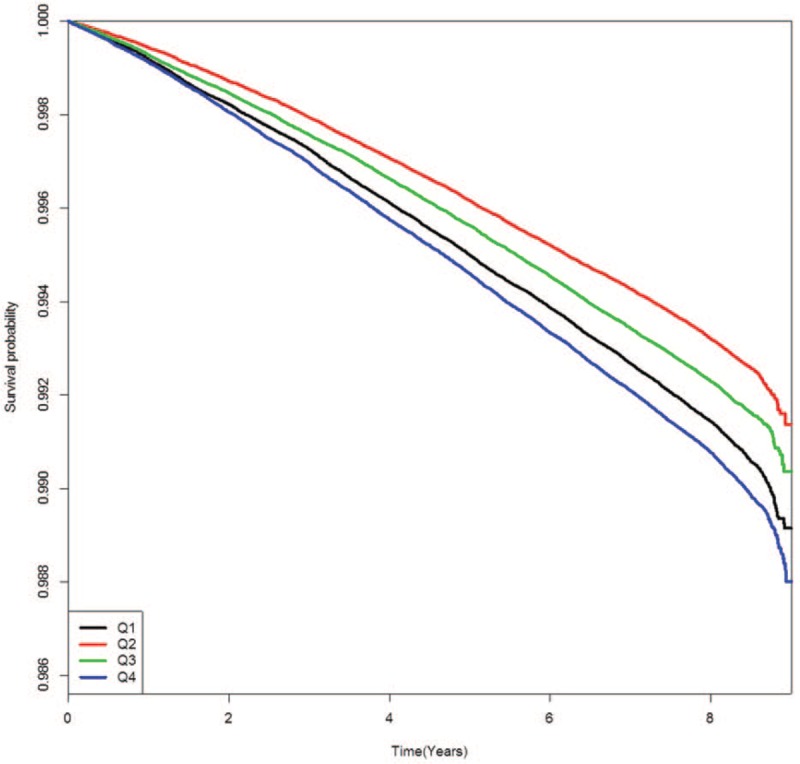
Kaplan–Meier event-free survival curves for stroke according to glycemic variability quartile.
Figure 3.
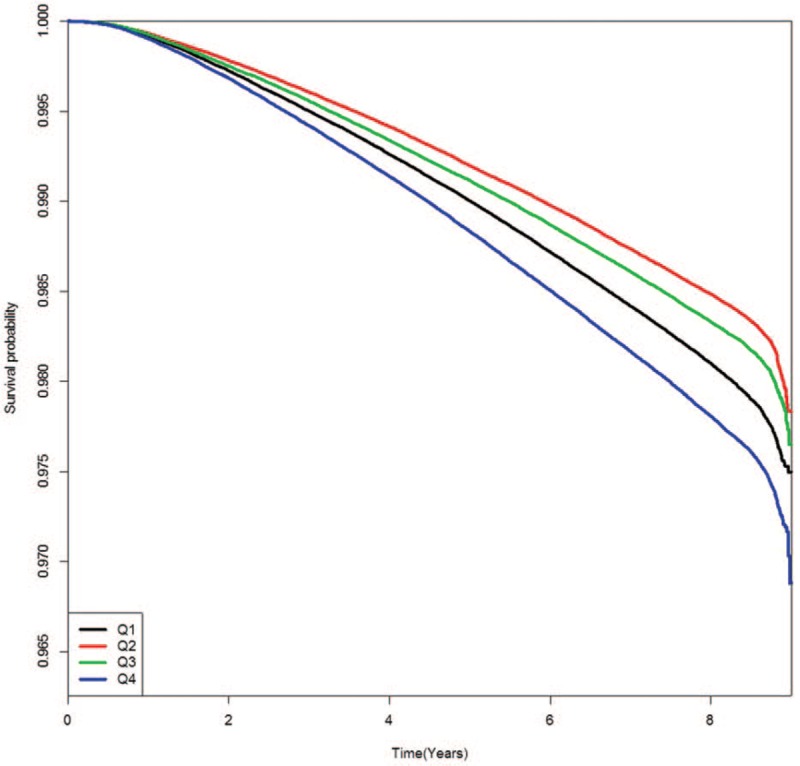
Kaplan–Meier event-free survival curves for all-cause death according to glycemic variability quartile.
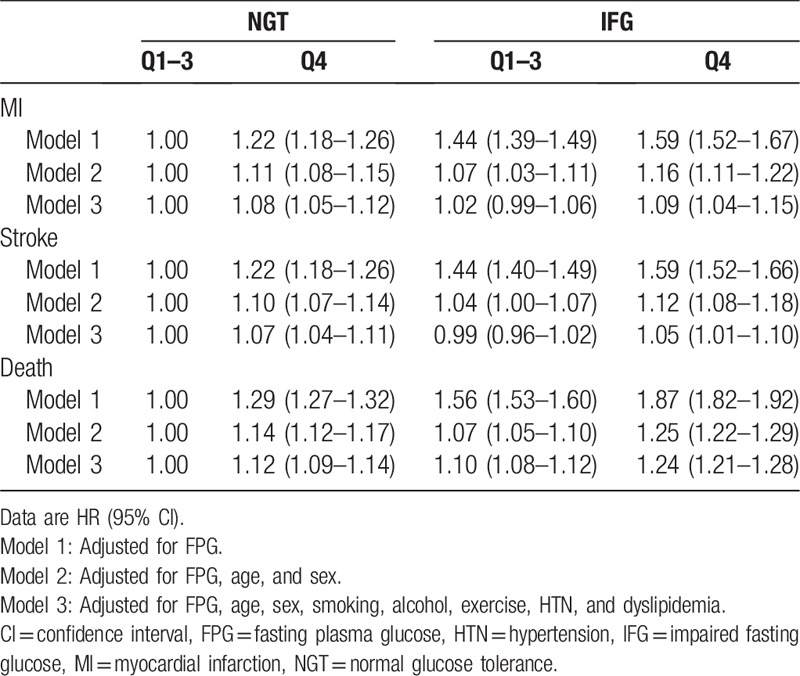
We also evaluated risk of MI, stroke, and all-cause death according to GV and FPG categories (Table 3). Compared with Q1–3 in the NGT group, Q4 in the NGT and IFG groups had comparable risks for MI and stroke. In contrast, HRs for Q1–3 in the IFG group did not increase for MI or stroke. The impact of higher GV and IFG was evident for mortality. HR for all-cause death increased by 12% in the Q4 group with NGT and 10% in the Q1–3 IFG group. HR was highest in the Q4 group with IFG (24%) compared to the Q1 to Q3 group with NGT.
Table 3.
Hazard ratios for death, myocardial infarction, and stroke according to quartiles of standard deviation of fasting plasma glucose and glucose tolerance status.
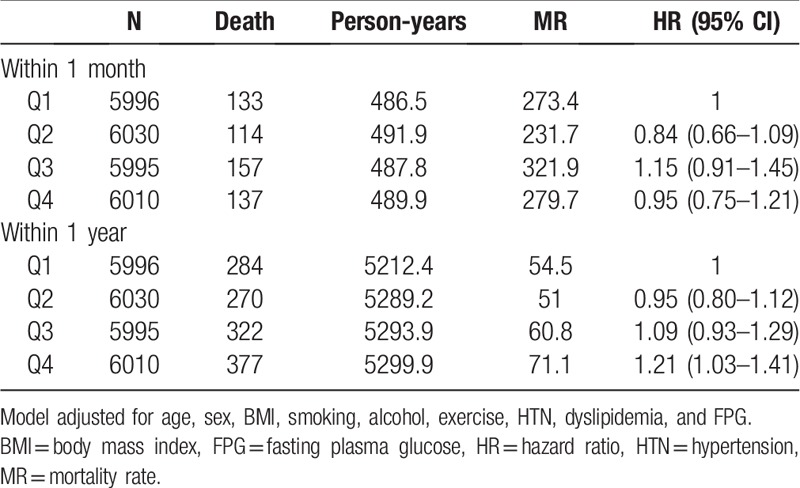
We analyzed prognosis of incident CVD according to FPG-GV. After MI or stroke events, 541 people died within 1 month and 1253 within 1 year (Table 4). HR for death within 1 month after a CVD event did not increase for Q4 compared to Q1. However, HR for death within 1 year after a CVD event was 1.21 (95% CI 1.03–1.41) for Q4 versus Q1. It was 1.22 (1.04–1.43) even after further adjustment for the change of FPG level.
Table 4.
Hazard ratios for death within 1 month or 1 year after cardiovascular disease event according to quartiles of fasting plasma glucose standard deviation.
4. Discussion
This study demonstrated that long-term FPG variation was independently associated with CVD and death in individuals without diabetes. We found that a high GV was associated with significantly increased risk for future cardiovascular events and all-cause mortality in a general population and poor prognosis for people with CVD without diabetes. The results suggested that elevated GV might be associated with greater risk of CVD and all-cause death, even in people without diabetes.
Several studies have shown that FPG variation is an independent predictor of total, cancer, and cardiovascular mortality in patients with diabetes.[11,19,20] Post hoc analysis of the Action in Diabetes and Vascular Disease: Preterax and Diamicron MR Controlled Evaluation (ADVANCE) dataset showed that visit-to-visit GV of FPG or HbA1c is associated with macrovascular events and mortality for patients with type 2 diabetes.[21] In the national cohort of the Taiwan Diabetes Study, visit-to-visit GV predicted the development of ischemic stroke[22] and end-stage renal disease[23] in patients with type 2 diabetes. These results suggest that GV over a long period is an important risk factor for vascular events and mortality.
However, to the best of our knowledge, no study found an association between GV and CVD or mortality in a general population without diabetes. The importance of high GV was shown in people with CVD regardless of diabetes. Higher GV measured by continuous glucose monitoring system compared to conventional glucose indicators is more strongly associated with larger plaque burden, plaque instability,[4] and rapid progression in patients with acute coronary syndromes.[5] Furthermore, elevated GV appears to be a more important risk factor than glucose or HbA1c level for predicting 1-year major adverse cardiac events in patients with acute MI.[8]
Several possible mechanisms might be involved in generating the associations between long-term GV and outcomes. First, glucose fluctuations can trigger adverse biological events and independently trigger oxidative stress, a key factor of atherosclerosis.[24] In patients with type 2 diabetes, daily blood glucose fluctuations are strong predictors of higher generation of oxidative stress.[24] Control of mean amplitude of glycemic excursions (MAGE) reduces markers of systemic inflammation and oxidative stress.[25] Oscillating glucose can have more deleterious effects than constant high glucose on endothelial function and oxidative stress in people with and without type 2 diabetes.[13] This finding suggests that GV is more strongly associated with atherogenic factors compared to sustained hyperglycemia represented by HbA1c and FPG. Endothelial dysfunction is generated by glucose oscillations in people with and without type 2 diabetes. Use of an antioxidant prevents this effect.[26] Second, repeated glycemic fluctuation increases inflammatory cytokines and macrophage adhesion to endothelial cells,[26,27] which are involved in atherosclerosis progression. However, whether these mechanisms should be interpreted in ways similar to their interpretation for people without diabetes is doubtful, because most studies have investigated patients with diabetes. Meugnier et al[28] showed that genes involved in free radical detoxification are downregulated during phases of acute hyperglycemia in normal participants. Insights from cultured vascular cells also identify the importance of posttranslational modification of histone tails in the persistent inflammatory response to glycemic variation.[29] Further studies are warranted to elucidate the associations between GV and outcomes in normoglycemic people.
As shown in Figures 1–3 in this study, the Kaplan–Meier cumulative risks for MI, stroke, and all-cause death were higher in the Q1 group than in the Q2 or Q3 group. The point that the Q1 group is older than the Q2 or Q3 group might be considered the main cause of higher incidence of events in the Q1 group. This trend disappeared when age and sex were adjusted in model 2 to 5 of Table 2. Although the interaction between the FPG and each outcome may be an important because the average FPG level has increased significantly from Q1 to Q4 group, there has been no significant interaction between the FPG and each outcome after adjustment for age and gender (data not shown).
Increasing GV is clearly related to higher mortality in critically ill patients, both with and without diabetes, independent of illness severity.[30–32] Results from a large multicenter study concluded that GV is a stronger predictor of intensive care unit mortality than mean glucose concentrations.[33] Even in noncritically ill patients, increased GV during hospitalization is independently associated with increased mortality.[32] These studies showed the prognostic impact of short-term GV during hospitalization. However, our study used relatively long-term GV in a stable state and demonstrated that the highest GV quartile was associated with 12% increased risk for death in a general population and 21% higher risk for 1-year death after CVD. When we did not consider FPG categories, the highest GV quartile conferred 12% increased risk of death; it escalated to 24% in the highest quartile for GV and IFG. This finding suggests that the impact of higher GV is stronger in people with prediabetes. Therefore, targeting these high-risk populations even though they do not have diabetes would be reasonable to reduce future CVD events and death.
We used SD among other GV indices to assess FPG variation. No gold standard exists for determining glucose variability. SD is most widely used to assess GV. MAGE,[34] M value,[35] continuous overlapping net glycemic action,[36] and mean of daily differences[37] are also frequently used as GV indices. Although these indices reflect different aspects of GV and largely correlate with each other, SD seemed like the best way to quantify GV.[38,39] Since SD is positively associated with mean value, the coefficient of variance (CV) has also been suggested as a strong independent index for measuring GV because it corrects for mean glucose level.[40] When we conducted our analysis using CV instead of SD, the results of our study did not differ (data not shown).
This study has some limitations. First, our findings were limited by potential residual and unrecognized confounding variables because this was an observational study. Second, we could not determine a causal relationship between elevated GV and CVD outcomes. GV might reflect the effects of coexisting illness or comorbidity that heighten the risk of CVD rather than directly cause it. Strengths of our study include a comparatively large nationwide population and a sufficiently long follow-up. Focusing on individuals without diabetes rather than patients with diabetes is another strong point of this study. We believe our study provides a novel perspective of the implications that GV might have in a general population without diabetes.
In conclusion, long-term FPG variation was positively associated with CVD and mortality in a general population without diabetes. The risk of death associated with higher GV increased even in those who developed CVD or who had IFG. Our findings imply that minimizing glucose fluctuations is important not only for patients with diabetes, but also healthy individuals without diabetes. Prospective studies will be needed to investigate the influence of lowering GV on cardiovascular outcomes in both populations.
Author contributions
Conceptualization: Nan Hee Kim, Kyung Mook Choi.
Data curation: Kyung Mook Choi.
Formal analysis: Kyungdo Han, Sanghyun Park, Yong Gyu Park.
Funding acquisition: Nan Hee Kim.
Investigation: Ji Hee Yu, Da Young Lee, Ga Eun Nam.
Writing – original draft: Ji Hee Yu.
Writing – review & editing: Ji A Seo, Sin Gon Kim, Sei Hyun Baik, Seon Mee Kim.
Supplementary Material
Footnotes
Abbreviations: ADVANCE = Action in Diabetes and Vascular Disease: Preterax and Diamicron MR Controlled Evaluation, BMI = body mass index, CI = confidence interval, CVD = cardiovascular disease, CV = coefficient of variance, DBP = diastolic blood pressure, FPG = fasting plasma glucose, HbA1c = glycated hemoglobin, GV = glycemic variability, HR = hazard ratio, HTN = hypertension, IFG = impaired fasting glucose, IGT = impaired glucose tolerance, IRB = Institutional Review Board, ICD-10 = International Classification of Diseases, 10th revision, MAGE = mean amplitude of glycemic excursions, MI = myocardial infarction, MR = mortality rate, NGT = normal glucose tolerance, NHIS = National Health Insurance Service, SBP = systolic blood pressure, SD = standard deviation.
Authors NHK and KMC contributed equally to this work.
This research was supported by a National Research Foundation of Korea (NRF) grant funded by the Korean government (MSIP) (No. 2015R1A2A2A01003167, 2015R1C1A2A01052010), and by a Korea University Grant (K1421551).
The authors have no conflicts of interest to disclose.
Supplemental Digital Content is available for this article.
References
- [1].Nathan DM, Cleary PA, Backlund JY, et al. Diabetes Control and Complications Trial/Epidemiology of Diabetes Interventions and Complications (DCCT/EDIC) Study Research Group. Intensive diabetes treatment and cardiovascular disease in patients with type 1 diabetes. N Engl J Med 2005;353:2643–53. [DOI] [PMC free article] [PubMed] [Google Scholar]
- [2].Holman RR, Paul SK, Bethel MA, et al. 10-year follow-up of intensive glucose control in type 2 diabetes. N Engl J Med 2008;359:1577–89. [DOI] [PubMed] [Google Scholar]
- [3].Brownlee M, Hirsch IB. Glycemic variability: a hemoglobin A1c-independent risk factor for diabetic complications. JAMA 2006;295:1707–8. [DOI] [PubMed] [Google Scholar]
- [4].Ceriello A. Postprandial hyperglycemia and diabetes complications: is it time to treat? Diabetes 2005;54:1–7. [DOI] [PubMed] [Google Scholar]
- [5].Chiasson JL, Josse RG, Gomis R, et al. Acarbose treatment and the risk of cardiovascular disease and hypertension in patients with impaired glucose tolerance: the STOP-NIDDM trial. JAMA 2003;290:486–94. [DOI] [PubMed] [Google Scholar]
- [6].Hu Y, Liu W, Huang R, et al. Postchallenge plasma glucose excursions, carotid intima-media thickness, and risk factors for atherosclerosis in Chinese population with type 2 diabetes. Atherosclerosis 2010;210:302–6. [DOI] [PubMed] [Google Scholar]
- [7].Temelkova-Kurktschiev TS, Koehler C, Henkel E, et al. Postchallenge plasma glucose and glycemic spikes are more strongly associated with atherosclerosis than fasting glucose or HbA1c level. Diabetes Care 2000;23:1830–4. [DOI] [PubMed] [Google Scholar]
- [8].Gorst C, Kwok CS, Aslam S, et al. Long-term glycemic variability and risk of adverse outcomes: a systematic review and meta-analysis. Diabetes Care 2015;38:2354–69. [DOI] [PubMed] [Google Scholar]
- [9].Cardoso CR, Leite NC, Moram CB, et al. Long-term visit-to-visit glycemic variability as predictor of micro- and macrovascular complications in patients with type 2 diabetes: The Rio de Janeiro Type 2 Diabetes Cohort Study. Cardiovasc Diabetol 2018;17:33. [DOI] [PMC free article] [PubMed] [Google Scholar]
- [10].Waden J, Forsblom C, Thorn LM, et al. A1C variability predicts incident cardiovascular events, microalbuminuria, and overt diabetic nephropathy in patients with type 1 diabetes. Diabetes 2009;58:2649–55. [DOI] [PMC free article] [PubMed] [Google Scholar]
- [11].Muggeo M, Zoppini G, Bonora E, et al. Fasting plasma glucose variability predicts 10-year survival of type 2 diabetic patients: the Verona Diabetes Study. Diabetes Care 2000;23:45–50. [DOI] [PubMed] [Google Scholar]
- [12].Quagliaro L, Piconi L, Assaloni R, et al. Intermittent high glucose enhances apoptosis related to oxidative stress in human umbilical vein endothelial cells: the role of protein kinase C and NAD(P)H-oxidase activation. Diabetes 2003;52:2795–804. [DOI] [PubMed] [Google Scholar]
- [13].Ceriello A, Esposito K, Piconi L, et al. Oscillating glucose is more deleterious to endothelial function and oxidative stress than mean glucose in normal and type 2 diabetic patients. Diabetes 2008;57:1349–54. [DOI] [PubMed] [Google Scholar]
- [14].Wang C, Lv L, Yang Y, et al. Glucose fluctuations in subjects with normal glucose tolerance, impaired glucose regulation and newly diagnosed type 2 diabetes mellitus. Clin Endocrinol (Oxf) 2012;76:810–5. [DOI] [PubMed] [Google Scholar]
- [15].Fox LA, Beck RW, Xing D. Juvenile Diabetes Research Foundation Continuous Glucose Monitoring Study Group. Variation of interstitial glucose measurements assessed by continuous glucose monitors in healthy, nondiabetic individuals. Diabetes Care 2010;33:1297–9. [DOI] [PMC free article] [PubMed] [Google Scholar]
- [16].Gude F, Díaz-Vidal P, Rúa-Pérez C, et al. Glycemic variability and its association with demographics and lifestyles in a general adult population. J Diabetes Sci Technol 2017;11:780–90. [DOI] [PMC free article] [PubMed] [Google Scholar]
- [17].Lee J, Lee JS, Park SH, et al. Cohort profile: The National Health Insurance Service-National Sample Cohort (NHIS-NSC), South Korea. Int J Epidemiol 2017;46:e15. [DOI] [PubMed] [Google Scholar]
- [18].Yang HK, Han K, Kwon HS, et al. Obesity, metabolic health, and mortality in adults: a nationwide population-based study in Korea. Sci Rep 2016;6:30329. [DOI] [PMC free article] [PubMed] [Google Scholar]
- [19].Lin CC, Li CI, Liu CS, et al. Annual fasting plasma glucose variation increases risk of cancer incidence and mortality in patients with type 2 diabetes: the Taichung Diabetes Study. Endocr Relat Cancer 2012;19:473–83. [DOI] [PubMed] [Google Scholar]
- [20].Nalysnyk L, Hernandez-Medina M, Krishnarajah G. Glycaemic variability and complications in patients with diabetes mellitus: evidence from a systematic review of the literature. Diabetes Obes Metab 2010;12:288–98. [DOI] [PubMed] [Google Scholar]
- [21].Hirakawa Y, Arima H, Zoungas S, et al. Impact of visit-to-visit glycemic variability on the risks of macrovascular and microvascular events and all-cause mortality in type 2 diabetes: the ADVANCE trial. Diabetes Care 2014;37:2359–65. [DOI] [PubMed] [Google Scholar]
- [22].Lin CC, Yang CP, Li CI, et al. Visit-to-visit variability of fasting plasma glucose as predictor of ischemic stroke: competing risk analysis in a national cohort of Taiwan Diabetes Study. BMC Med 2014;12:165. [DOI] [PMC free article] [PubMed] [Google Scholar]
- [23].Yang YF, Li TC, Li CI, et al. Visit-to-visit glucose variability predicts the development of end-stage renal disease in type 2 diabetes: 10-year follow-up of Taiwan Diabetes Study. Medicine (Baltimore) 2015;94:e1804. [DOI] [PMC free article] [PubMed] [Google Scholar]
- [24].Monnier L, Mas E, Ginet C, et al. Activation of oxidative stress by acute glucose fluctuations compared with sustained chronic hyperglycemia in patients with type 2 diabetes. JAMA 2006;295:1681–7. [DOI] [PubMed] [Google Scholar]
- [25].Rizzo MR, Barbieri M, Marfella R, et al. Reduction of oxidative stress and inflammation by blunting daily acute glucose fluctuations in patients with type 2 diabetes: role of dipeptidyl peptidase-IV inhibition. Diabetes Care 2012;35:2076–82. [DOI] [PMC free article] [PubMed] [Google Scholar]
- [26].Esposito K, Nappo F, Marfella R, et al. Inflammatory cytokine concentrations are acutely increased by hyperglycemia in humans: role of oxidative stress. Circulation 2002;106:2067–72. [DOI] [PubMed] [Google Scholar]
- [27].Ceriello A, Ihnat MA. ’Glycaemic variability’: a new therapeutic challenge in diabetes and the critical care setting. Diabet Med 2010;27:862–7. [DOI] [PubMed] [Google Scholar]
- [28].Meugnier E, Faraj M, Rome S, et al. Acute hyperglycemia induces a global downregulation of gene expression in adipose tissue and skeletal muscle of healthy subjects. Diabetes 2007;56:992–9. [DOI] [PubMed] [Google Scholar]
- [29].Brasacchio D, Okabe J, Tikellis C, et al. Hyperglycemia induces a dynamic cooperativity of histone methylase and demethylase enzymes associated with gene-activating epigenetic marks that coexist on the lysine tail. Diabetes 2009;58:1229–36. [DOI] [PMC free article] [PubMed] [Google Scholar]
- [30].Krinsley JS. Glycemic variability: a strong independent predictor of mortality in critically ill patients. Crit Care Med 2008;36:3008–13. [DOI] [PubMed] [Google Scholar]
- [31].Hermanides J, Vriesendorp TM, Bosman RJ, et al. Glucose variability is associated with intensive care unit mortality. Crit Care Med 2010;38:838–42. [DOI] [PubMed] [Google Scholar]
- [32].Mendez CE, Mok KT, Ata A, et al. Increased glycemic variability is independently associated with length of stay and mortality in noncritically ill hospitalized patients. Diabetes Care 2013;36:4091–7. [DOI] [PMC free article] [PubMed] [Google Scholar]
- [33].Egi M, Bellomo R, Stachowski E, et al. Variability of blood glucose concentration and short-term mortality in critically ill patients. Anesthesiology 2006;105:244–52. [DOI] [PubMed] [Google Scholar]
- [34].Service FJ, Molnar GD, Rosevear JW, et al. Mean amplitude of glycemic excursions, a measure of diabetic instability. Diabetes 1970;19:644–55. [DOI] [PubMed] [Google Scholar]
- [35].Schlichtkrull J, Munck O, Jersild M. The M-value, an index of blood-sugar control in diabetics. Acta Med Scand 1965;177:95–102. [DOI] [PubMed] [Google Scholar]
- [36].McDonnell CM, Donath SM, Vidmar SI, et al. A novel approach to continuous glucose analysis utilizing glycemic variation. Diabetes Technol Ther 2005;7:253–63. [DOI] [PubMed] [Google Scholar]
- [37].Molnar GD, Taylor WF, Ho MM. Day-to-day variation of continuously monitored glycaemia: a further measure of diabetic instability. Diabetologia 1972;8:342–8. [DOI] [PubMed] [Google Scholar]
- [38].Rodbard D. The challenges of measuring glycemic variability. J Diabetes Sci Technol 2012;6:712–5. [DOI] [PMC free article] [PubMed] [Google Scholar]
- [39].Monnier L, Colette C, Owens DR. Glycemic variability: the third component of the dysglycemia in diabetes. Is it important? How to measure it? J Diabetes Sci Technol 2008;2:1094–100. [DOI] [PMC free article] [PubMed] [Google Scholar]
- [40].Rodbard D. Clinical interpretation of indices of quality of glycemic control and glycemic variability. Postgrad Med 2011;123:107–18. [DOI] [PubMed] [Google Scholar]
Associated Data
This section collects any data citations, data availability statements, or supplementary materials included in this article.


