Figure3.

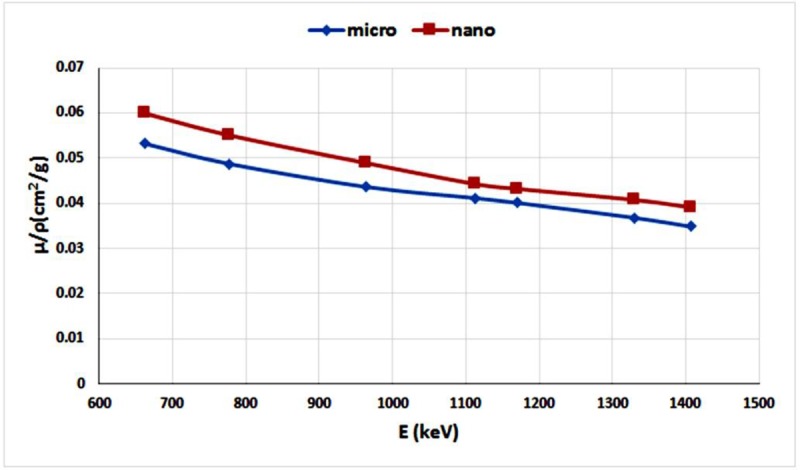
Diagram shows the changes in mass attenuation coefficients of the micro- and nanocomposites under study based on energy level.

Diagram shows the changes in mass attenuation coefficients of the micro- and nanocomposites under study based on energy level.