Figure 3.

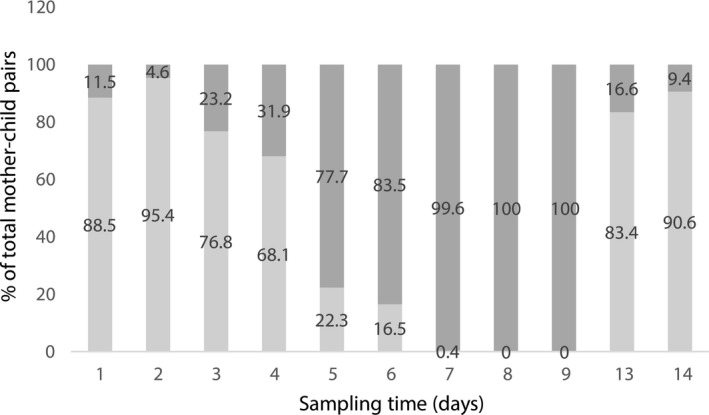
Proportion of the imputed observations vs. the actual measured observations in the imputed full data set. Light gray bars represent the actual (measured) observations; dark gray bars represent the imputed (simulated) observations.

Proportion of the imputed observations vs. the actual measured observations in the imputed full data set. Light gray bars represent the actual (measured) observations; dark gray bars represent the imputed (simulated) observations.