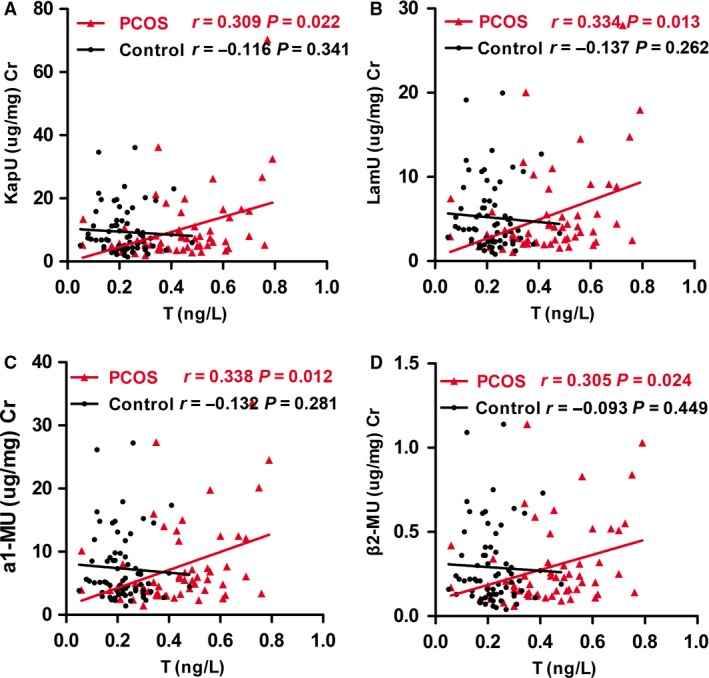
Figure 3.

Correlation analysis between serum testosterone and tubular proteinuria in PCOS patients and controls, respectively. (A) Correlation between the level of T and KapU in PCOS patients and controls, respectively. (B) Correlation between the level of T and LamU in PCOS patients and controls, respectively. (C) Correlation between the level of T and a1‐MU in PCOS patients and controls, respectively. (D) Correlation between the level of T and β2‐MU in PCOS patients and controls, respectively. PCOS, polycystic ovary syndrome; KapU, human immunoglobulin/light chain κ‐type; LamU, human immunoglobulin/light chain λ‐type; α1‐MU, α1‐microglobulin; β2‐MU, β2‐microglobulin.
