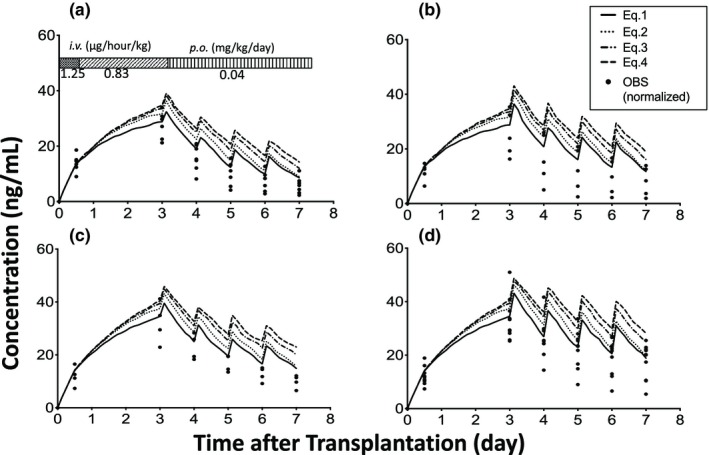
Figure 2.

Effect of liver regeneration rate on the blood concentration of tacrolimus immediately after living‐donor liver transplantation. (a) cytochrome P450 3A5 (CYP3A5)*1 allele in both the graft liver and small intestine (L*1/I*1), (b) CYP3A5*1 allele in the graft liver and CYP3A5*3/*3 in the small intestine (L*1/I*3), (c) CYP3A5*3/*3 in the graft liver and CYP3A5*1 allele in the small intestine (L*3/I*1), and (d) CYP3A5*3/*3 in both the graft liver and small intestine (L*3/I*3). Each closed circle shows the observed concentration normalized by the dosing regimen (OBS). The number of patients with L*1/I*1, L*1/I*3, L*3/I*1, and L*3/I*3 were 7, 5, 4, and 10, respectively. i.v., intravenous; p.o., per oral.
