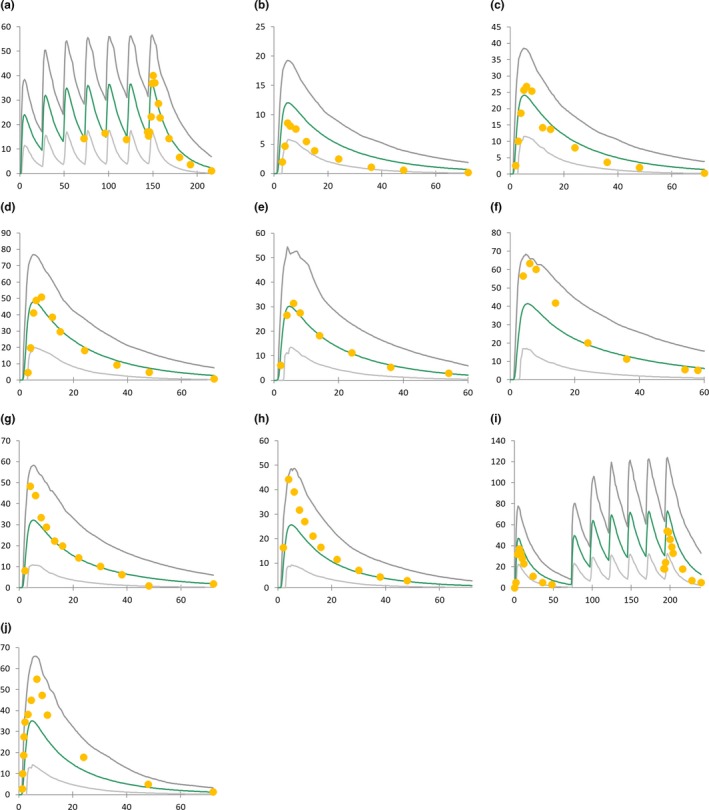
Figure 1.

Simulated vs. observed duloxetine pharmacokinetic profiles. Green lines represent mean simulated pharmacokinetic profile, and gray lines represent the 5% and 95% percentiles of model‐predicted pharmacokinetic profiles. The x‐axis represents time after drug intake (hour), and the y‐axis represents plasma concentration (ng/mL). Observed data were taken from published trials: (a–d)42 (e, f)43 (g, h)44 (i)45 and (j)46
