Figure 11.

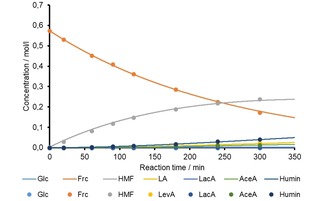
Change of the composition of the hydrothermally treated product solution as function of reaction time; the dots represent the experimental values, the curves are modelled according to model 2.

Change of the composition of the hydrothermally treated product solution as function of reaction time; the dots represent the experimental values, the curves are modelled according to model 2.