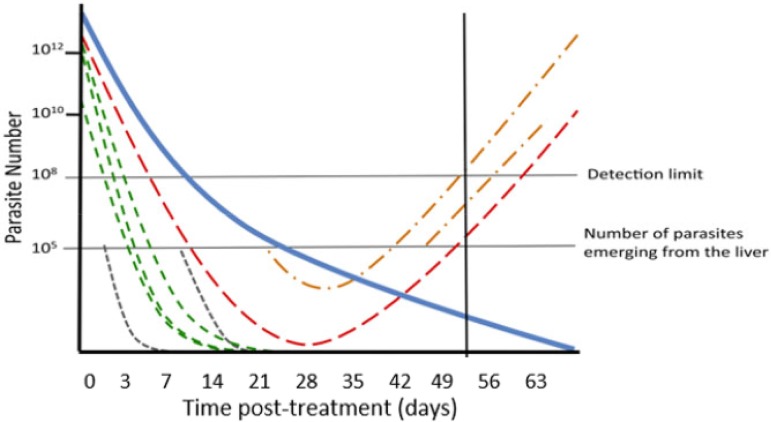
FIG 1.
Malaria parasite dynamics following treatment of a hypothetical patient and the need for molecular correction (adapted from Jaki et al. [26]). Note that parasites only become detectable in the patient’s blood by light microscopy once their numbers exceed a detection limit at 108 parasites. The blue solid line shows the declining concentration of drug posttreatment as it is eliminated by the patient’s metabolism. This patient had four malaria clones detectable at the time of treatment. The green lines represent initial clones that are cleared by the drug, and the red line represents an initial clone that recrudesces. Reinfections periodically emerge from the liver during follow-up in cohorts of ∼105 parasites per clone. The gray lines are reinfections that are cleared by the drug. The orange lines are reinfections that are not cleared and survive to reach patency (i.e., increase in number to ≥108, at which point they are detectable by microscopy). The solid black line is the point during follow-up at which the patient first has a patent recurrent infection (i.e., has a parasitemia sufficiently high that it is detectable by microscopy).

