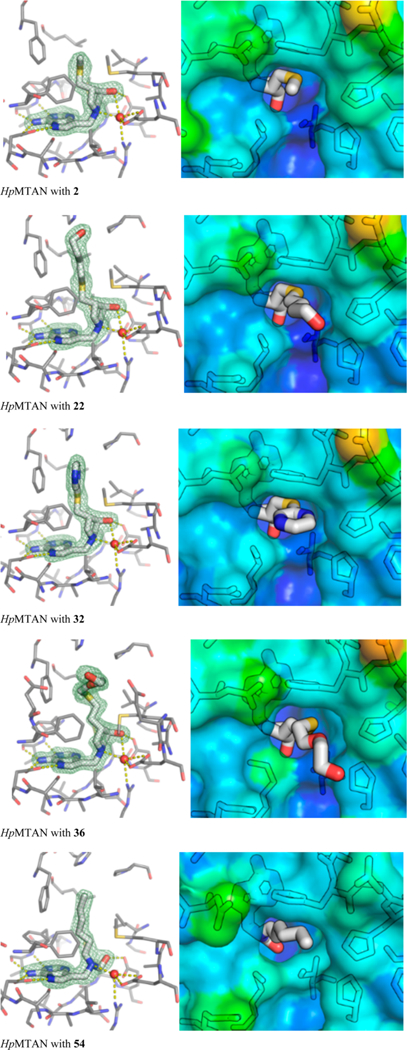
Figure 5.

HpMTAN bound to various inhibitors. Left: electron densities greater than 1 RMSD around the ligand, in maps calculated with 2 Fobs − Fcalc coefficients. Right: Surface representation of protein residues at active site entrance (colored by B-factor), with respective inhibitors shown as sticks.
