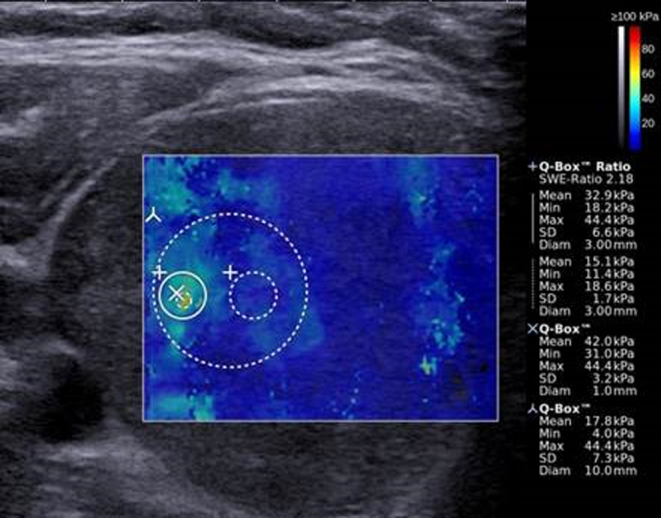
Figure 1.

SWE image depicting the ROIs used for EI measurements. Color-coded elasticity map overlying the B-mode US image. Soft areas with a low EI are colored blue, and changes to green, yellow and red with higher EI and increasing stiffness. To the right, the elasticity scale (0–100 kPa, top) and the EI measurements for the predefined ROIs (bottom) are shown.

 This work is licensed under a