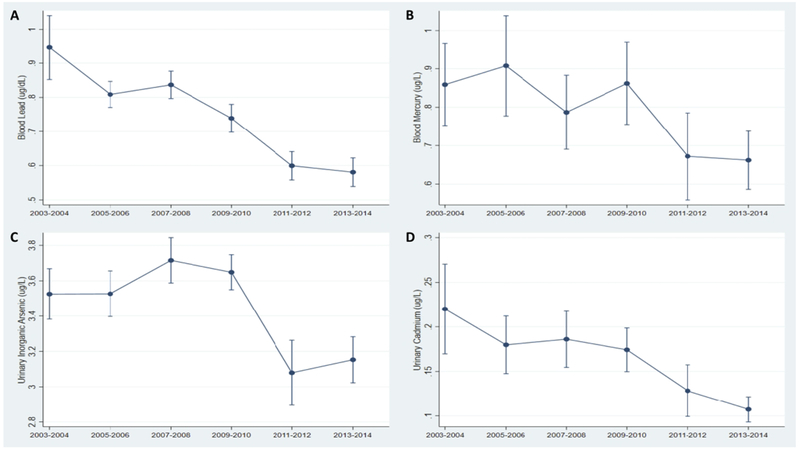
Figure 1. Temporal trends in metal biomarkers among women of reproductive age, NHANES 2003-2014.
A. Geometric mean concentrations of blood lead (μg/dL); B. Geometric mean concentrations of blood mercury (μg/L); C. Geometric mean concentrations of urinary inorganic arsenic (μg/L); D. Geometric mean concentrations of urinary cadmium (μg/L).

