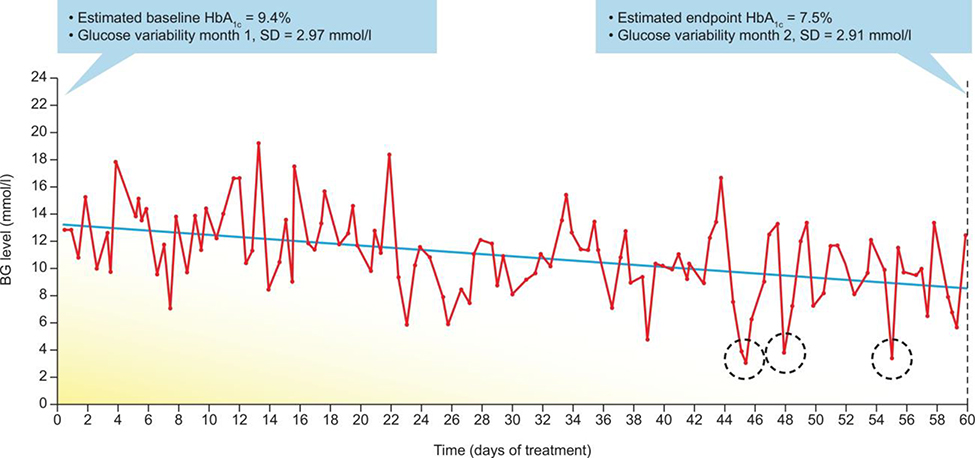
FIGURE 1.
Risk of hypoglycemia and improved glycemic control. Self-monitored blood levels of glucose recorded over 60 days. A downward trend in blood levels of glucose is evident; levels of HbA1c (estimated by the use of a linear formula) decreased from 9.4% at baseline to 7.5% by the end of the observation period. However, glucose variability remained relatively unchanged from the first to the second month of observation, which resulted in 3 hypoglycemic episodes (<3.9 mmol/L) registered by self-monitoring blood glucose at days 45, 48 and 55 (dotted circles). Reproduced with permission from Springer Nature: Nature Reviews Endocrinology, Metrics for glycaemic control—from HbA1c to continuous glucose monitoring, Kovatchev, 2017.3Abbreviations: HbA1c, hemoglobin A1c; SD, standard deviation

