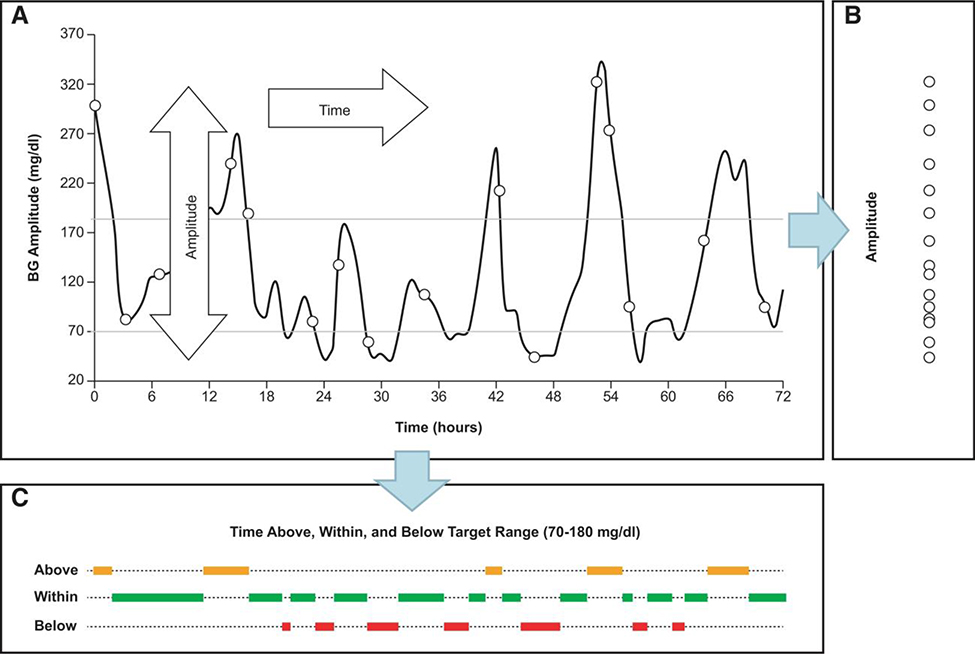
FIGURE 2.
Principal components of GV. Glucose fluctuations are a process in time that has 2 dimensions—amplitude and time (A). Projected along its amplitude axis, this process is measured by metrics such as SD or MAGE (B). Projected along its time axis, this process is assessed by temporal characteristics, such as time within target range and time spent in hypoglycemia or hyperglycemia (C). Reproduced with permission from Kovatchev et al.37 Glucose variability: timing, risk analysis and relationship to hypoglycemia in diabetes, American Diabetes Association, 2016. Copyright and all rights reserved. Material from this publication has been used with the permission of American Diabetes Association. Abbreviations: BG, blood glucose; MAGE, mean amplitude of glycemic excursions; SD, standard deviation.

