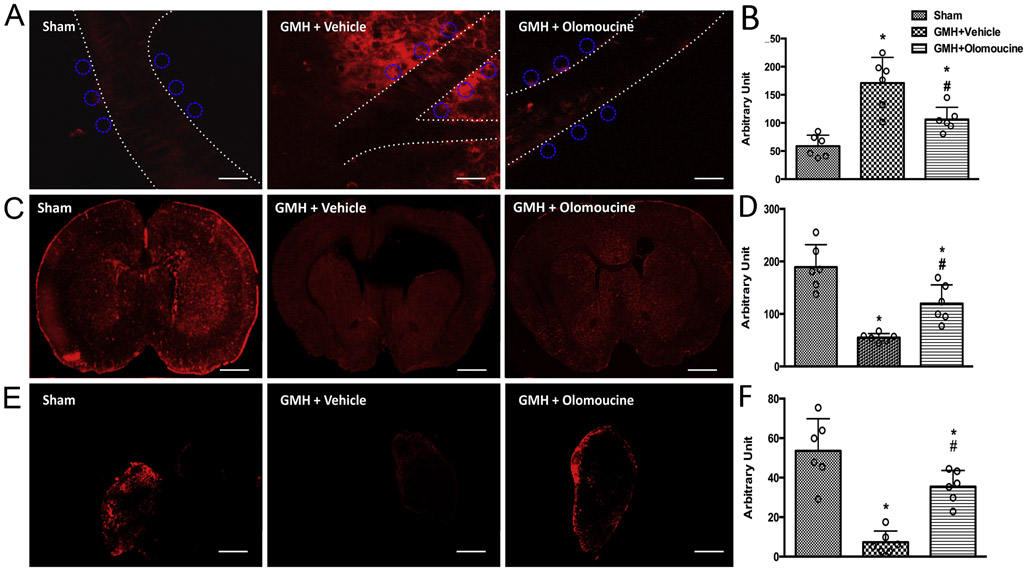
Figure 4.
GMH animals demonstrated impaired glymphatic function, as shown by decreased CSF-ISF exchange and reduced CSF reabsorption into the dcLNs while olomoucine treatment improved the glymphatic function at 28 days after GMH. A. Representative images of tracer-constituted CSF in the paravascular area. Scale bar = 40μm. ROIs are demonstrated as circles. B. Quantitation of fluorescence intensity in the paravascular area. C. Representative images of tracer-constituted CSF throughout the whole coronal brain sections. Scale bar = 1.7mm. D. Quantitation of fluorescence intensity throughout the brain. E. Representative images of dcLNs. Scale bar = 300μm. F. Quantitation of fluorescence intensity inside the dcLNs. Values are expressed as mean ± SD. One-way ANOVA with Tukey’s test. *P < 0.05 compared with Sham, #P < 0.05 compared with GMH + Vehicle. N=6.

