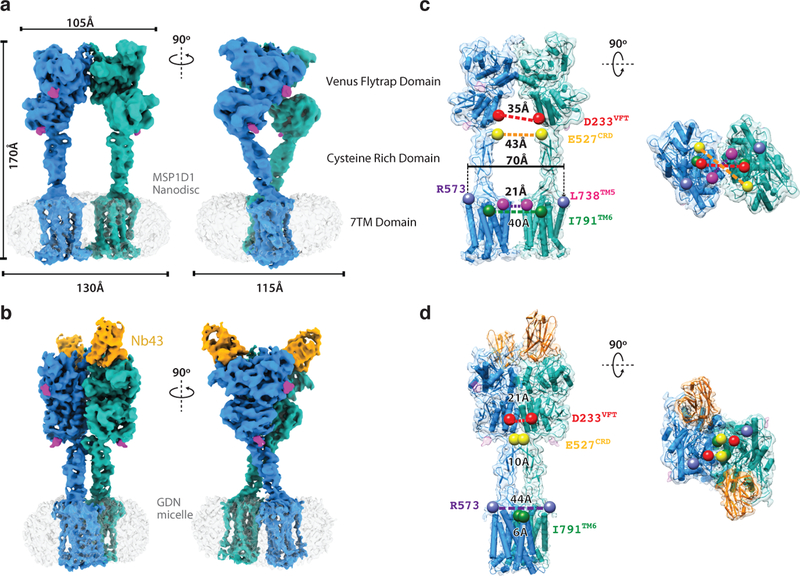
Figure 3. Cryo-EM Maps and Models of Full Length mGlu5.
Cryo-EM maps of full length mGlu5 in the a) apo-VFT state, and the b) active state bound to Nb43, and L-quisqualate. Left panels in a) and b) show the same view of mGlu5 in the apo and active conformation, respectively. Right panels in a) and b) are 90˚ rotated relatively to left panels a) and b). Models of apo (c) and active (d) mGlu5 are shown from side (c, d, left panels) and top (c, d, right panels) views. Positions in the VFT (red), CRD (yellow), CRD/7TM interface (purple), and 7TM domain (green) show that the active state is characterized by smaller intersubunit distances. The TM5 position in the apo model (pink) shows that at their closest point, the 7TM domains remain separated.

