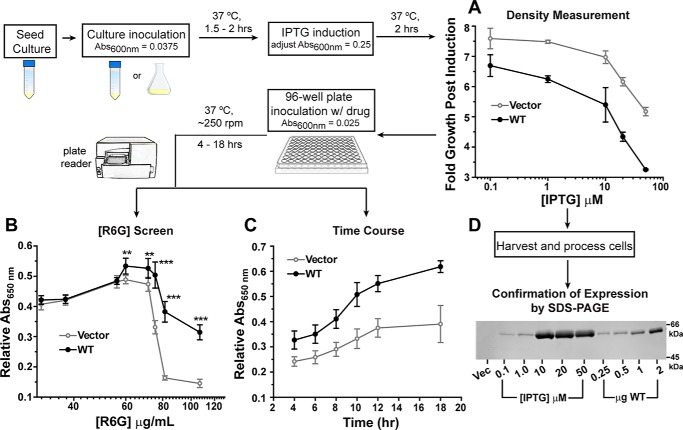
Figure 1.
Flow diagram of the R6G resistance assay. A, comparison of growth for cells harboring the vector (gray line) and WT PfMATE (black line) after 2-h induction with different IPTG concentrations. B, expression of WT PfMATE increases cell survival at elevated R6G concentrations relative to the vector control. Each data point represents the average of two independent experiments. For each experiment, the data were measured in triplicate from separate wells on the plate after 10 h at 37 °C. A650 nm in the presence of R6G was normalized to the 0 μg/ml R6G well. The standard deviation is shown for each data point. The p values were determined by an unpaired t test: **, p = 0.004–0.009; ***, p < 0.0001. C, cells expressing WT PfMATE demonstrate better growth than the vector control at all time points. A650 nm in the presence of R6G was normalized to the 0 μg/ml R6G well. The R6G concentration was 75 μg/ml. The data points are shown with the standard deviation, and each data point was generated from three to six independent experiments as described for B. D, the relative expression of WT PfMATE as a function of IPTG concentration was visualized by SDS-PAGE and staining with InVision His tag stain. Purified PfMATE WT used as a standard is shown for comparison. Vec, vector.

