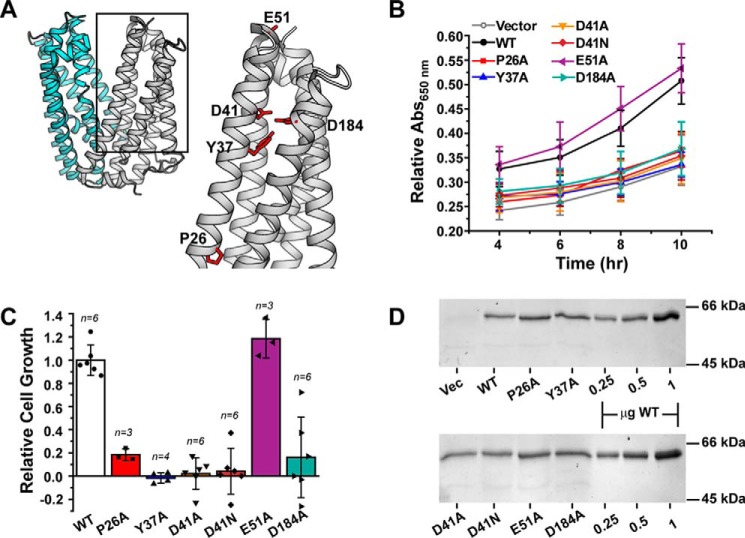
Figure 2.
R6G resistance profiles for NTD residue substitutions. A, structure of PfMATE (PDB code 3VVN), highlighting the location of residues chosen for site-directed mutagenesis in the NTD (gray). The CTD is shown in cyan. B, time course of cell growth for the variants relative to both the vector and WT at 37 °C in the presence of 75 μg/ml R6G. The curves were generated from at least three independent experiments as described under “Experimental procedures” and in the legend for Fig 1. A650 nm in the presence of R6G was normalized to the 0 μg/ml R6G well. The standard deviation is shown for each data point. C, the data in B at the 10-h time point were transformed into a cell growth profile relative to WT PfMATE after subtracting the contribution of the vector control. The bar plot highlights the average ± S.D. for the indicated number of measurements. One-way ANOVA indicated that the population means were significantly different at the 0.05 level: F (6, 27) = 28.82, p = 1.57 × 10⁻¹⁰. D, SDS-PAGE followed by InVision His tag staining confirmed similar levels of expression for each construct. The last three lanes on each gel image show purified PfMATE WT used as a standard. Vec, vector.

