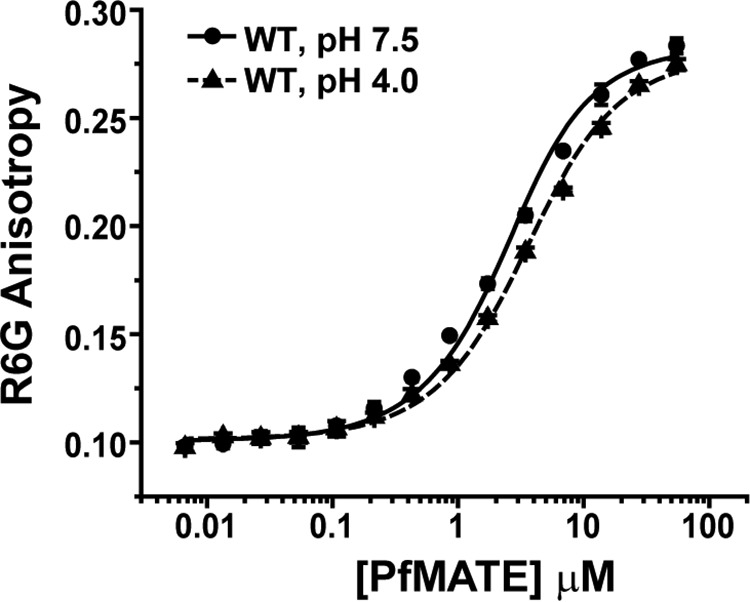
Figure 3.

Binding curves of R6G to WT PfMATE. Changes in the fluorescence anisotropy of R6G were plotted as a function of protein concentration in β-DDM buffer at the indicated pH and 23 °C. The data points represent the average ± S.D. of three binding experiments, and the solid and dashed lines are nonlinear least square fits of the curves to obtain the KD (Table 1).
