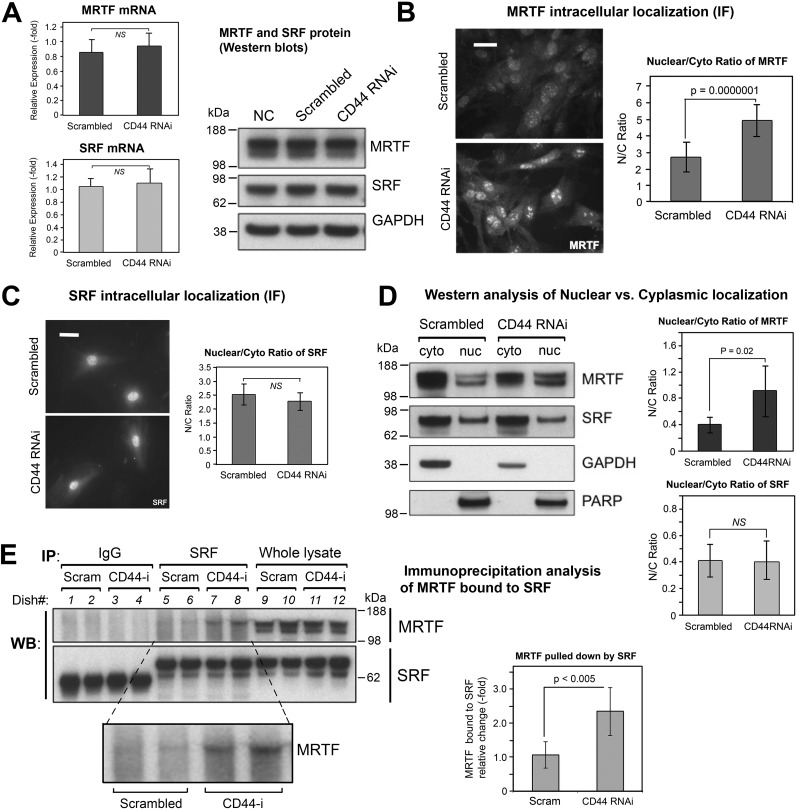
Figure 6.
The effect of CD44 knockdown on gene expression and subcellular localization of MRTF and SRF. A, mRNA levels of MRTF and of SRF by qPCR (left), mean ± S.D. of three experiments; protein levels of MRTF and SRF by Western blot analysis (right), showing no difference in response to CD44 RNAi treatment. B, MRTF-A immunofluorescent staining in fibroblasts transfected with CD44 RNAi or scram RNAi (left). Scale bar, 50 μm. Digital analysis of staining intensity to provide MRTF nuclear/cytoplasmic ratio (right); mean ± S.D., 100 cells analyzed per condition. C, SRF immunofluorescent staining in cells transfected as in (B) (left); scale bar 50 μm. Digital analysis of SRF Nuc/Cyto ratio (right). D, subcellular fractionation of MRTF in fibroblasts transfected with CD44 RNAi or scram RNAi. Left, representative Western blotting of MRTF from cytoplasmic (cyto) or nuclear (nuc) fractions, along with GAPDH and PARP as controls for purity of the cyto and nuc fractions, respectively. Right, Nuc/Cyto ratio of MRTF, determined from densitometric scanning (IPLab) of bands in two independent experiments, mean ± S.D. E, immunoprecipitation analyses to assess binding between SRF and MRTF in fibroblasts transfected with CD44 or scram RNAi. An anti-SRF antibody (SRF) or normal rabbit immunoglobulin (IgG) was added to the cell lysates to pulldown protein complexes, and the membrane probed with anti-MRTF or anti-SRF antibodies (left). Quantitative analysis of the SRF-bound MRTF band (inset) is shown in the graph (right); bars, mean ± S.D. of two experiments with duplicate samples.

