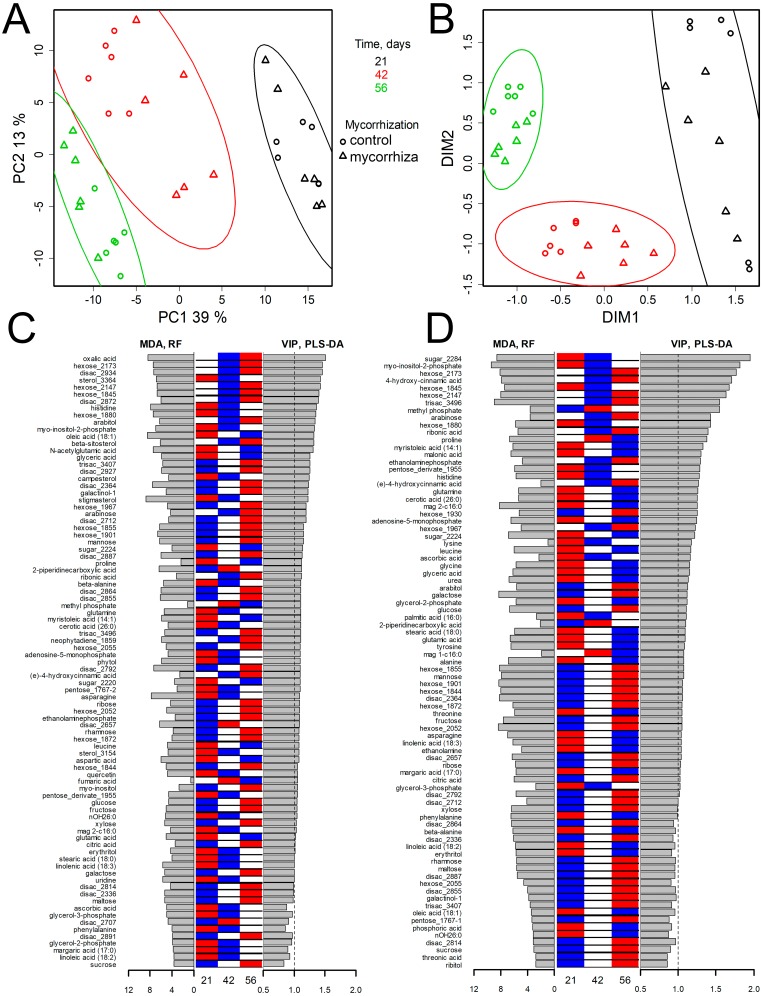
Figure 3. Age dependent metabolome shifts in pea leaves of cv. Finale at different stages of plant development.
(A, B) Visualization of metabolic profiles in the low dimensional spaces. (A) PCA score plot, % is the variance associated with a PC. (B) Result of the dimension reduction by Local Linear Embedding (k = 18). Ellipses—95% CI. (C, D) Supervised selection of features related to aging: barplots of Mean Decrease Accuracy from Random Forest and VIPs from PLS-DA combined with heatmap of means for every age for control plants (C), and plants inoculated with R. irregularis (D). Stage descriptions are given in Fig. 1.

