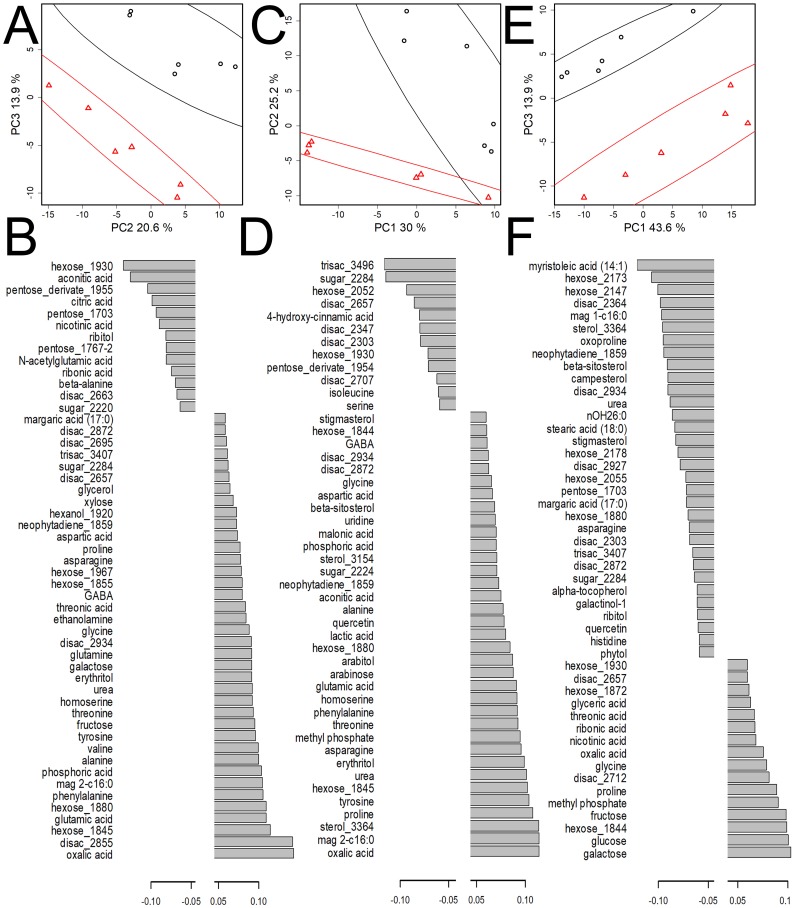
Figure 4. Comparative analysis of metabolite profiles of mycorrhizal and control pea plants of cv. Finale at different stages of plant development.
(A, B) 21 DPI, stage II; (C, D) 42 DPI, stage IV; (E, F) 56 DPI, stage V. (A, C, E) PCA score plot, % is the variance associated with the PC. Ellipses—95% CI, circles represent control, the triangles represent the mycorrhizal plants. (B, D, F) Diagrams of loadings of the OPLS-DA predictive component (VIP > 1). Negative values correspond to a higher content in control plants and vice versa. Stage descriptions given in Fig. 1.

