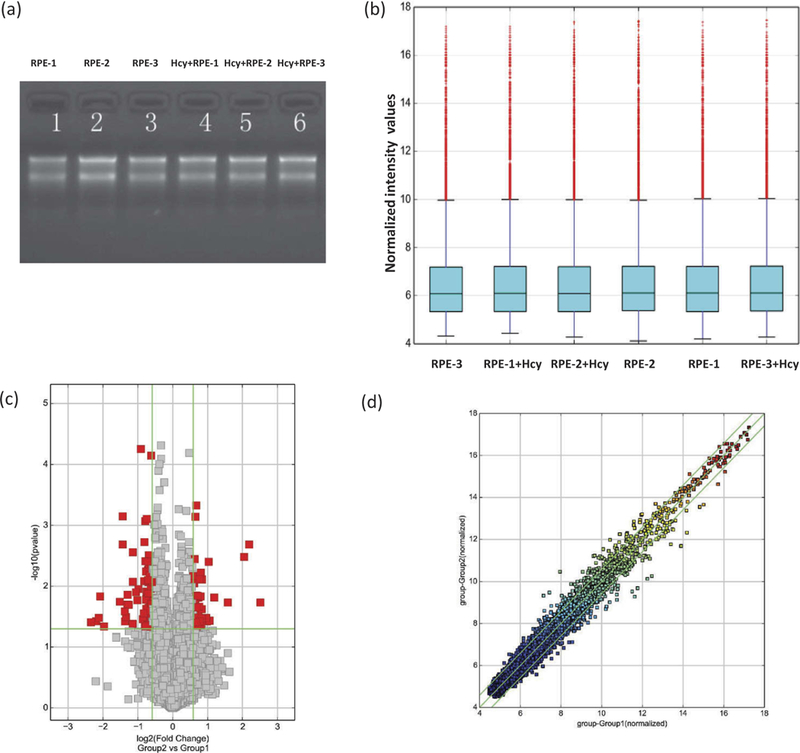
Figure 1.

Assessment of RNAs’ integrity, genomic DNA contamination, and cRNAs’ differential expressions. (a) Denaturing agarose gel electrophoresis of samples: Lane 1, 2, and 3 represent total RNAs from untreated, and 4, 5, and 6 from Hcy-treated ARPE-19 cells. (b) A box plot showing a homogeneous distribution expression values in Hcy-treated and untreated ARPE-19 cells after comparing the distributions of intensities from all samples after normalization. (c) Volcano plot for the evaluation of differential expression as derived from the expression profiling of circRNAs’ from Hcy-treated and untreated ARPE-19 cells. Respective difference of each circRNA from one another between Group 2 (Hcy-treated) versus Group 1 (untreated cells). Gray points represent circRNAs that show no statistical significance while the red points represent the differentially expressed circRNAs with statistical significance. The vertical lines correspond to 2.0-fold (log2 scaled) up and down, respectively, and the horizontal line represents a p-value of 0.05 (−log10 scaled). (d) The scatter-plot of cRNAs’ averaged normalized value variation between Group 1; untreated (x-axis) and Group 2; Hcy-treated RPE cells (y-axis). The circRNAs above the top green line and below the bottom green line indicate more than 2.0-fold changes in circRNAs. Middle green line refers to no difference between the groups.
