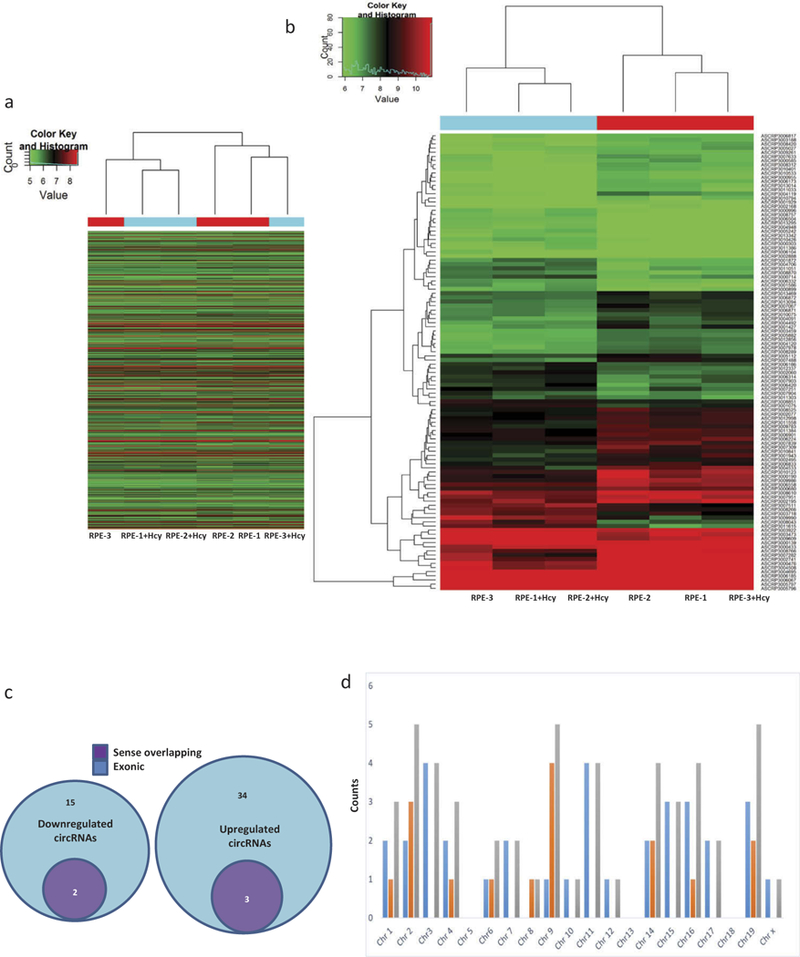
Figure 2.

(a) Heat map of Group 2 (Hcy-treated) versus Group 1 (untreated) showing expression of all target values of circRNAs, their respective up and down-regulated patterns between ARPE-19 cells. Each column in the map represents a sample, and each row represents a circRNA. The red strip represents high relative expression, and green strip represents low relative expression. (b) Measurement of circRNAs’ relative expression activities employing the hierarchical cluster analysis for the respective up and down-regulated data sets between the Group 2 (Hcy-treated) versus Group-1 (untreated) ARPE-19 cells. Red represents high relative expression and green low relative expression. (c) Differentially expressed circRNAs according to the extent of changes between Hcy-treated and untreated ARPE-19 cells depicting down-regulated and up-regulated circRNAs. Nature of each circRNA’s origin is color-coded. (d) Chromosomal distributions of differentially expressed circRNAs with color codes illustrate their expression profiles with respect to the abundance of total circRNAs between Group 1 versus Group 2.
