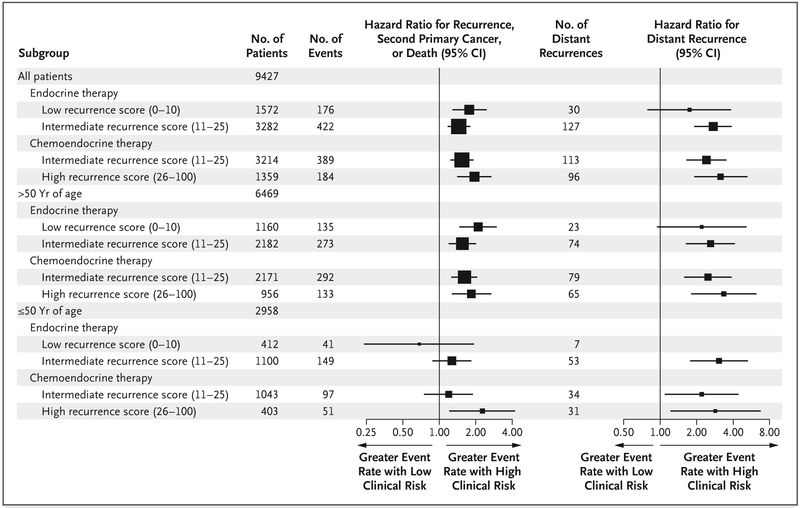
Figure 1. Effect of Clinical Risk on Prognosis in the Entire Population and Stratified According to Age.
Hazard ratios and 95% confidence intervals (CIs) for a high versus low clinical risk of invasive disease recurrence, second primary cancer, or death and for distant recurrence (a hazard ratio of >1 indicates a higher event rate with high clinical risk) are shown. There were no distant recurrences among 64 patients in the subgroup who had a high clinical risk and a low recurrence score. CIs have not been adjusted for multiple comparisons, and inferences drawn from the intervals may not be reproducible. The size of each square corresponds to the size of the subgroup; the horizontal lines represent the 95% CI.

