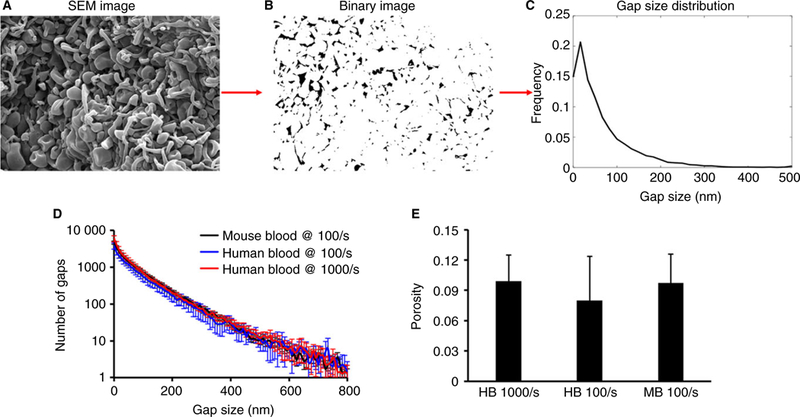
Fig. 2.

Analysis of SEM images of platelet aggregates. (A) An example of a scanning electron image of a platelet aggregate obtained from flowing whole blood over collagen and tissue factor. (B) Binary image version of image A obtained after thresholding. (C) Using a custom-written code in MATLAB (Supplementary Material) a binary image is scanned to obtain the gap size distribution. In all three types of platelet aggregates the gap size distribution (D) and overall surface porosity (E) are statistically equivalent.
