Fig. 3.

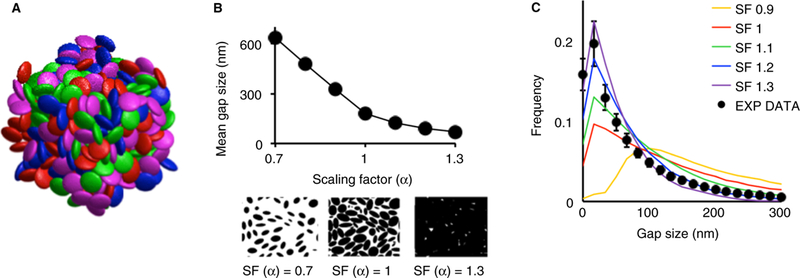
Computational reconstruction of the platelet aggregate microenvironment. (A) An example of a randomly jammed ellipsoid packing. Each ellipsoid semi-axis measures 1, 1 and 0.4 μm, respectively. Colors are for illustration purpose only. (B) Once a jammed ellipsoid packing is achieved, the volume of each ellipsoid can be expanded, or contracted, by multiplying each semi-axis by a scaling factor. This process is illustrated by the two images below the horizontal axis showing how a cross-section of the 3-D packing changes with different values of the scaling factor. As the scaling factor increases, the volume of each ellipsoid also increases, causing intersection between ellipsoids, thus reducing the porous fraction (not shown) and the mean gap size. (C) Gap size frequency distributions computed from ellipsoid packings with different scaling factors and compared with the gap size distribution of the mouse wild-type data. Values of the scaling factor between 1.1 and 1.3 result in gap size distributions that approximate the distribution measured from experimental data.
