
Figure 4. KRas G13D Has a Distinct Phenotype from that of Wild-Type KRas and KRas G12D in the Murine Colonic Epithelium.
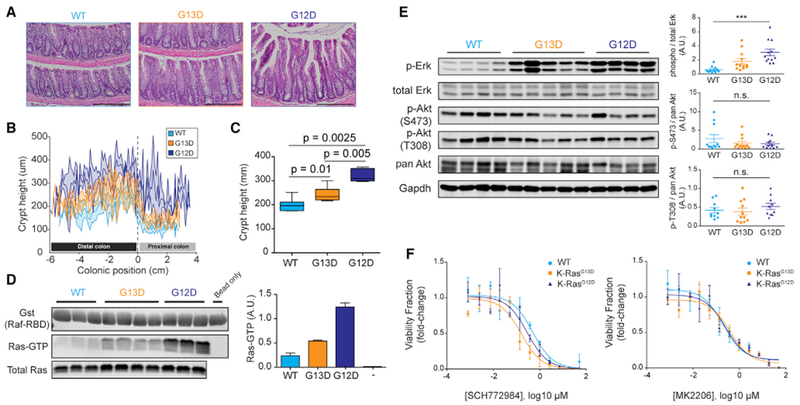
(A) H&E staining of formalin-fixed and paraffin-embedded colon Swiss rolls (5 μm) from 8- to 12-week-old mice. Scale bar, 200 μm.
(B) Crypt height measurements across the entire length of the colon from H&E stains in (A). Measurements were taken every 5 crypts, and the curves are composites of measurements from 7 wild type (Fabpl-Cre), 7 G13D, and 5 G12D.
(C) Quantification of data in (B).
(D) Affinity precipitation of Ras-GTP using Raf-RBD. Each pull-down used 500 μg colon lysate from 8- to 12-week-old mice, while total Ras blot was done with 50 μg lysate. Right, quantification of band intensities from 3 wild-type, 4 G13D, and 3 G12D pull-down experiments.
(E) Representative western blot of wild-type, G13D, and G12D colon lysate for phosphorylated-to-total protein from Erk1/2, pan-Akt, and its two phosphorylation sites T308 and S473. Right, quantitation of western blot bands from 11 wild type, 12 G13D, and 12 G12D biological replicates for Erk and pAkt S473, and 10 wild-type, 11 G13D, and 10 G12D biological replicates for pAkt T308; ***p < 0.0001, 1-way ANOVA (Kruskal-Wallis). Error bars of quantitated western blot data represent SEMs (±SEMs).
(F) Response of murine colonic organoids of various KRas alleles to 6 days of Akt (MK2206) and Erk (SCH772984) treatment. Data show luminescence averages from three biological replicates per genotype, and curves were fit with nonlinear regression. Error bars of luminescence data ± SEMs.