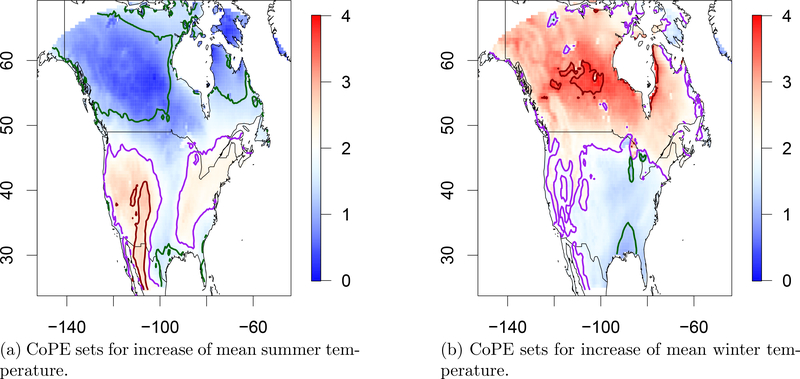
Figure 1:
Output of our method for the increase of the mean summer (June-August) and winter (December-February) temperatures. Shown are heat maps of the estimate of the difference. The uncertainty in the excursion set estimate (purple boundary) for c = 2◦C is captured by the CoPE sets (red boundary) and (green boundary). The threshold was obtained according to Theorem 1 to guarantee inclusion with confidence 1−α = 0.9. The horizontal and vertical axes are indexed in degrees longitude and latitude, respectively.

