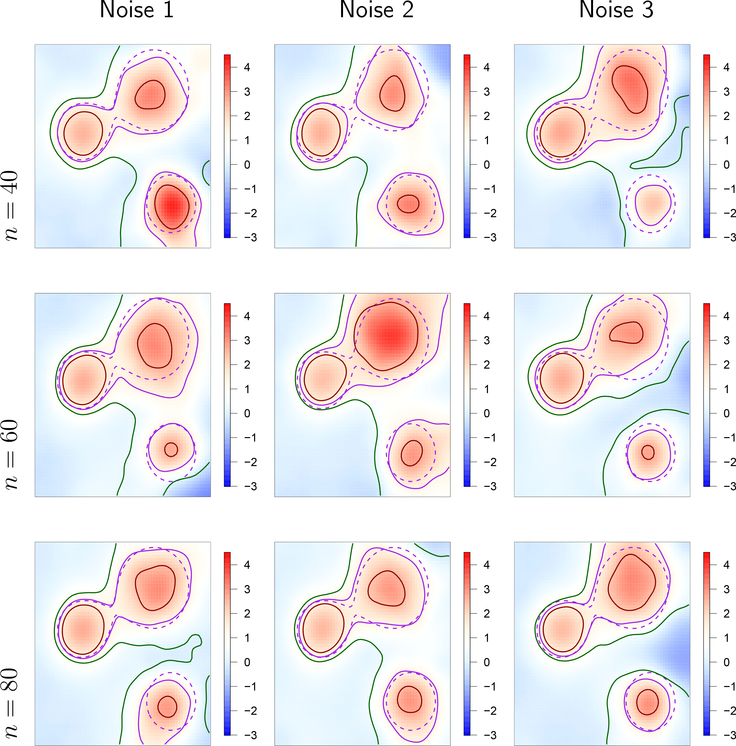
Figure 4:
Single realizations of the output of our method at confidence level 90% for the three noise fields (rows) and for sample sizes n = 40,60,80 (columns) with the target function μ(s) from Figure 3a. In all pictures we show a heat map of the estimator , the boundary of Ac(μ) (solid purple) and (dashed purple) and the boundaries of (red) and (green). The threshold a was obtained using the multiplier bootstrap and the plug-in estimate of the boundary Ac.

