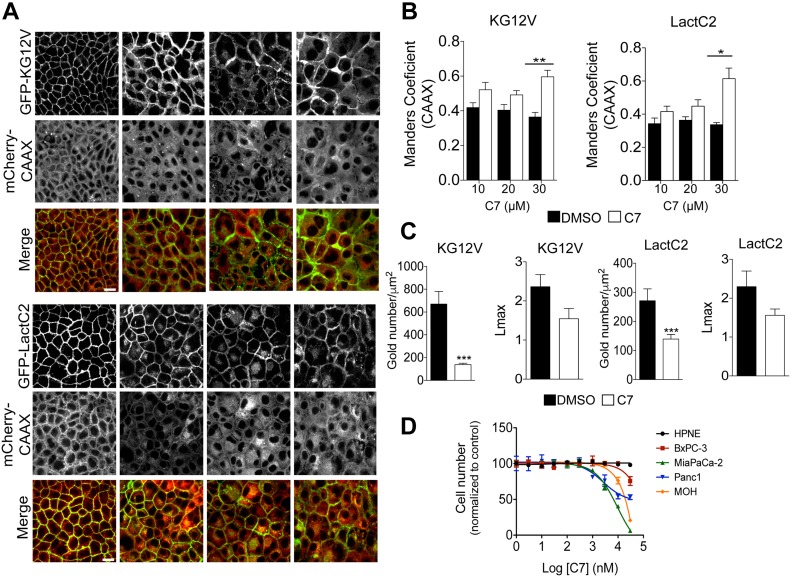
Figure 7. PI4KIIIα inhibition mislocalizes KRAS and PtdSer from PM and inhibits growth of KRAS-dependent pancreatic cancer cells.
(A) MDCK cells stability expressing GFP-KG12V and mCherryCAAX or GFP-LactC2 and mCherryCAAX were treated with DMSO or the PI4KIIIα inhibitor C7 for 72 h at varying concentrations, and then imaged with confocal microscopy. Representative images are shown. (B, C) The extent of KRAS and LactC2 mislocalization was quantified using Manders coefficient, which measures the extent of colocalization/overlap of GFP and mCherry signals. Significant differences were quantified using t tests (±SEM, n ≥ 5) (C) Basal PM sheets from MDCK cells in (A) treated with 30 μM of C7 for 48 h were prepared and labeled with anti-GFP antibodies coupled directly to 4.5-nm gold particles and visualized by EM. The amount of KRASG12V and LactC2 on the PM was measured as gold particle labeling per μm2, and significant differences were quantified using t tests. KRAS and LactC2 clustering were quantified by univariate spatial analysis, summarized as Lmax values and significant differences were assessed using bootstrap tests (±SEM, n ≥ 12). (D) HPNE, BxPC-3, MiaPaCa-2, PANC-1 and MOH cells were seeded in 96-well plates. After 24 h, fresh growth medium supplemented with 1% DMSO or increasing C7 concentrations were added and the cells were allowed to grow for another 72 h and then counted (±SEM, n = 3) (*P < 0.05, **P < 0.01, ***P < 0.001; KG12V: KRASG12V, LactC2: PtdSer probe), scale bar 20 μm.

