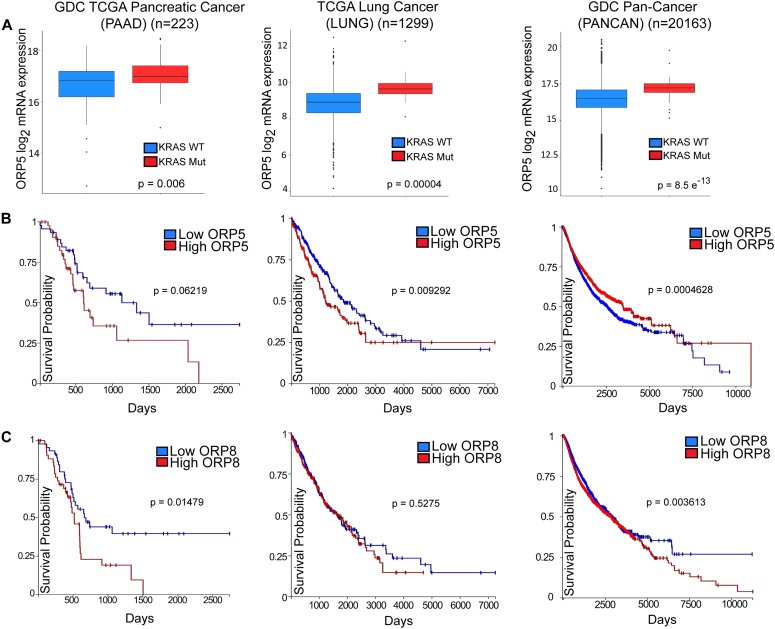
Figure 8. High expression levels of OSBPL5 and OSBPL8 correlate with poorer prognosis in cancer patients.
(A, B, C) Box plots indicating quartiles of ORP5 mRNA expression level in patient samples in cohorts of pancreatic cancer (GDC TCGA PAAD, n = 223), lung cancer (TCGA LUNG, n = 1,299), and of 33 types of cancer (GDC Pan-Cancer [PANCAN], n = 20,163) with or without KRAS mutations. Statistical significance was analyzed with Welch’s t test. Kaplan–Meier survival plots based on expression levels of ORP5 (B) and ORP8 (C) in cohorts listed in (A). Plots were generated using the University of California, Santa Cruz (UCSC) Xena Browser.

