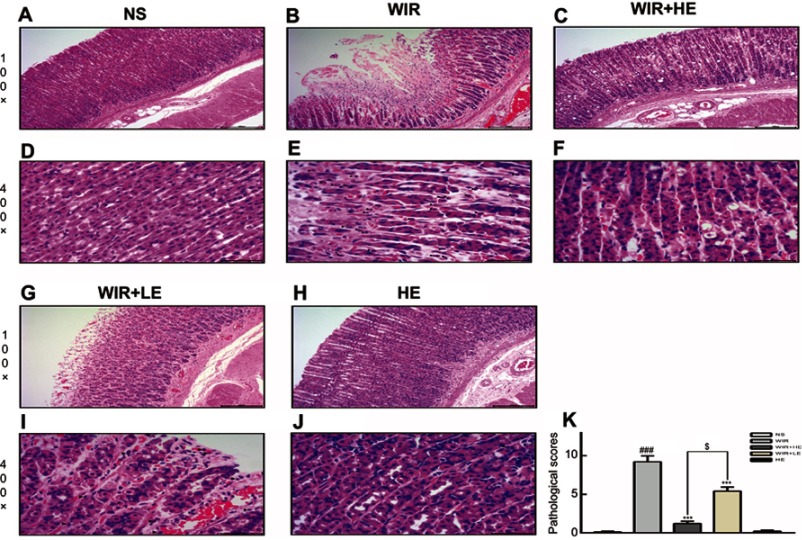
Figure 2.
H&E-stained gastric cross-sections and microscopic changes of rat.
Notes: (A–C, G, H) Microscopic images of the gastric mucosa, 100×. (D–F, I, J) Inflammatory cells among the gastric epithelium, 400×. ▲ labels inflammatory cells. (K) Pathological score. The data are expressed as the mean ± SEM of ten animals per group and at least three independent experiments. ###P<0.001 was considered significantly different between the WIR group and the NS group; ***P<0.001 was considered significantly different between the WIR group and either the HE-WIR group or the LE-WIR group; $P<0.05 was considered significantly different between the HE-WIR group and the LE+WIR group.

