
Figure 10.
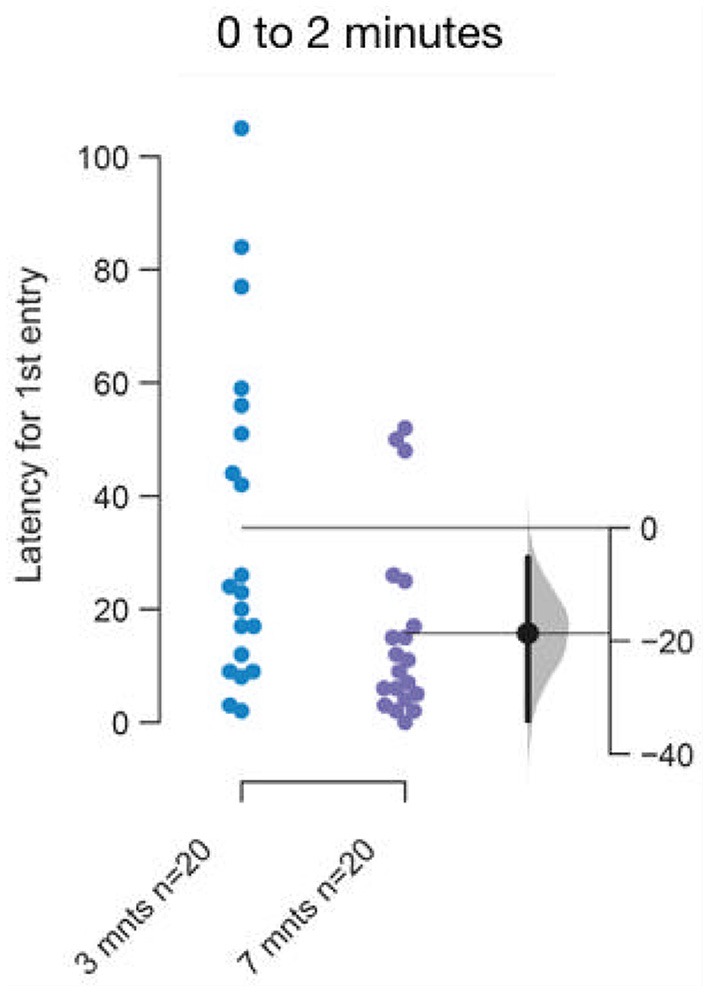
Faster acclimation to novel talk in 7–9 months or older fish. The mean difference between top and bottom lit groups are shown in Gardner-Altman estimation plot. The latency to make the first entry into the top half of the tank is reduced in older fish. Each dot in the group represents the response of one individual. N = 20 per group. Groups are plotted on the left axes, while the mean difference between the groups is depicted as a black dot and is plotted on a floating axes on the right. Ends of the bar around the mean shows 95% confidence interval. The shaded region in gray is 5,000 bootstrap sampling distribution.